. 2007 Apr;4(4):e124.
doi: 10.1371/journal.pmed.0040124.

TREM2-transduced myeloid precursors mediate nervous tissue debris clearance and facilitate recovery in an animal model of multiple sclerosis

Affiliations

TREM2-transduced myeloid precursors mediate nervous tissue debris clearance and facilitate recovery in an animal model of multiple sclerosis

Kazuya Takahashi et al. PLoS Med. 2007 Apr.

Abstract

Background: In multiple sclerosis, inflammation can successfully be prevented, while promoting repair is still a major challenge. Microglial cells, the resident phagocytes of the central nervous system (CNS), are hematopoietic-derived myeloid cells and express the triggering receptor expressed on myeloid cells 2 (TREM2), an innate immune receptor. Myeloid cells are an accessible source for ex vivo gene therapy. We investigated whether myeloid precursor cells genetically modified to express TREM2 affect the disease course of experimental autoimmune encephalomyelitis (EAE), an animal model of multiple sclerosis.

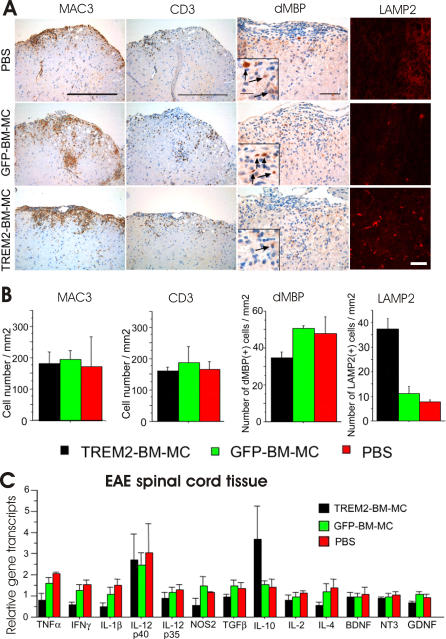
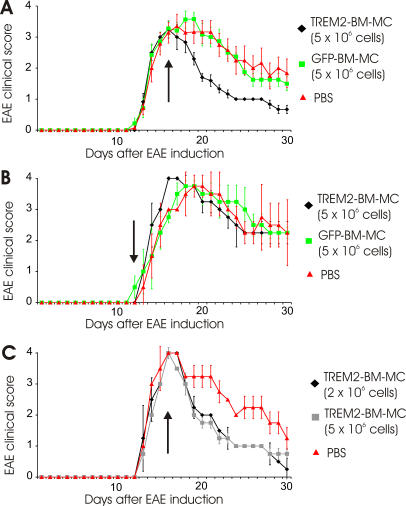
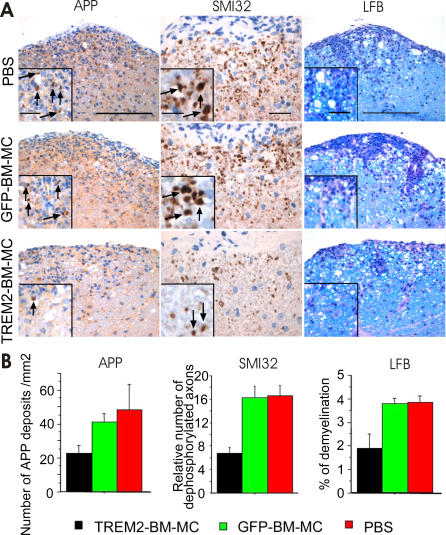
Methods and findings: EAE was induced in mice by immunization with a myelin autoantigen. Intravenous application of TREM2-transduced bone marrow-derived myeloid precursor cells at the EAE peak led to an amelioration of clinical symptoms, reduction in axonal damage, and prevention of further demyelination. TREM2-transduced myeloid cells applied intravenously migrated into the inflammatory spinal cord lesions of EAE-diseased mice, showed increased lysosomal and phagocytic activity, cleared degenerated myelin, and created an anti-inflammatory cytokine milieu within the CNS.

Conclusions: Intravenously applied bone marrow-derived and TREM2-tranduced myeloid precursor cells limit tissue destruction and facilitate repair within the murine CNS by clearance of cellular debris during EAE. TREM2 is a new attractive target for promotion of repair and resolution of inflammation in multiple sclerosis and other neuroinflammatory diseases.


Conflict of interest statement

Competing Interests: The authors have declared that no competing interests exist.

Figures

Figure 1
Figure 1. Expression Profile of TREM2 in Normal and Diseased CNS
(A) Flow cytometry analysis of TREM2 (open tracings) expression on CD11b+ cells derived from the cortex of normal and EAE-diseased mice at day 4 after onset of clinical symptoms as well as from EAE-diseased mice at day 18 after onset of clinical symptoms. Isotype controls are shown in grey-filled tracings. TREM2 expression is detected on CD11b+ microglia/macrophages in the cortex of EAE-diseased mice. The percentages of TREM2+ cells are indicated in the upper-right corner of each histogram. Selected representative histograms are shown. (B) Quantitative analysis of TREM2 expression on microglia by flow cytometry gated for CD11b+ cells. TREM2 expression is detected only on a minority of microglia and perivascular macrophages in the normal CNS tissue, but is up-regulated and detected in the spinal cord on the majority of CD11b+ cells at day 4 after onset of clinical symptoms of EAE. Data are presented as mean ± SEM. Tissues were derived from four EAE and four normal mice.
Figure 2
Figure 2. Characterization and TREM2 Transduction of BM-MC
(A) Flow cytometry analyses of BM-MC. Bone marrow cells were cultured for 10 d in GM-CSF–containing medium and then analyzed by flow cytometry with specific antibodies (open tracings) directed against CD45, CD11b, CD11c, MHC class II, CD80, CD86, F4/80, CD36, TREM2, Sca1, c-kit, and CD133. Cells showed expression of CD45, F4/80, CD11b, CD11c, and CD36. The percentage of positive cells is indicated in the upper-right corner of each histogram. Isotype controls are shown in grey-filled tracings. (B) Lentiviral vector design. To express TREM2 in BM-MC, the mouse TREM2 coding sequence was cloned under the CMV promoter followed by a second CMV promoter and GFP (plenti TREM2). The same vector without TREM2 was used as a control (plenti GFP). (C) Gene transcripts in myeloid cells transduced with TREM2 vector (TREM2-BM-MC) or control GFP vector (GFP-BM-MC) for TREM2, DAP12, and the housekeeping gene GAPDH were analyzed by RT-PCR. Gene transcripts for TREM2 were strongly detected in TREM2-BM-MC and weakly in GFP-BM-MC. Both TREM2-transduced myeloid cells and control GFP vector–transduced myeloid cells showed gene transcription for DAP12, the TREM2 adapter and signaling molecule. (D) Flow cytometry analysis of TREM2-transduced BM-MC (bold line) and GFP-transduced BM-MC (narrow line), both labeled with TREM2-specific antibodies. Isotype control antibody is shown in filled grey. Cell surface expression of TREM2 was detected on myeloid cells after lentiviral transduction with TREM2, but not on control GFP vector–transduced myeloid cells.
Figure 3
Figure 3. Myeloid Cells Transduced with TREM2 Showed Increased Phagocytic and Anti-Inflammatory Activity In Vitro
(A) TREM2-transduced myeloid cells showed increased phagocytosis of beads and of apoptotic neuron–enriched cultures. Analysis of the phagocytosis of beads (left graph), TREM2-transduced myeloid cells (open bars), control GFP vector–transduced myeloid cells (filled bars), or cultured monocytes (grey bars) after stimulation with TREM2-specific antibodies either untreated (−) or treated with ERK inhibitor (+). Phagocytosis assay (right graph) of apoptotic cells derived from neuron-enriched cultures by TREM2-transduced myeloid cells (open bars), control GFP vector–transduced myeloid cells (filled bars), or cultured monocytes (grey bars), either treated with ERK inhibitor (+) or untreated (−). Transduction of myeloid cells (BM-MC) with TREM2 increased the phagocytosis of beads and apoptotic cells that were dependent on ERK phosphorylation. Data are presented as mean ± SEM. Unpaired t-test: p < 0.001 (TREM2 versus GFP) for BM-MC without ERK inhibitor and with bead phagocytosis, and p < 0.001 (TREM2 versus GFP) for BM-MC without ERK inhibitor and with phagocytosis of apoptotic neurons. Five independent experiments were performed, and each of them was done in quadruplicate. (B) Anti-inflammatory activity of TREM2 stimulation. Myeloid cells were transduced with TREM2 (open bars) or control GFP vector (filled bars). Myeloid cells were cultured on plates coated with TREM2 cross-linking antibodies (left graph). One hour later, cells were stimulated with LPS. Gene transcript levels for TNFα, IL-1β, NOS2, and IL-10 were quantified by real-time PCR after 48 h. TREM2-transduced myeloid cells showed reduced gene transcript levels of IL-1β and NOS2 and an increased level of IL-10. In addition, apoptotic cells derived from neuron-enriched cultures were added to myeloid cells (right graph). Gene transcript levels for TNFα, IL-1β, NOS2, and IL-10 were quantified by real-time PCR after 48 h. Data are presented as mean ± SEM. Unpaired t-test: p < 0.001 (TREM2 versus GFP) with TREM2 plus LPS for IL-1, p = 0.0205 (TREM2 versus GFP) with TREM2 plus LPS for IL-10, p = 0.0149 (TREM2 versus GFP) with coculture for IL-1, and p = 0.012 (TREM2 versus GFP) with coculture for NOS2. Four independent experiments were performed. (C) Phosphorylation of ERK after stimulation of TREM2. Myeloid cells were transduced with TREM2 and cultured for 1 h on plates coated with TREM2 cross-linking antibodies (+) or isotype control antibodies (−). Cross-linking of TREM2 increased the amount of phosphorylated ERK (phospho ERK) in relation to total ERK (ERK). (D) TREM2-transduced myeloid cells showed an increased release of IL-10 after stimulation of TREM2 plus LPS or coculture with apoptotic neuron–enriched cultures. Myeloid cells were transduced with TREM2 (open bars) or with control GFP vector (filled bars), cultured on plates coated with TREM2 cross-linking antibodies, and stimulated with LPS 1 h later or supplemented with apoptotic cells derived from neuron-enriched cultures. The amount of IL-10 released in the supernatant was determined by ELISA. Data are presented as mean ± SEM. Unpaired t-test: p = 0.044 (TREM2 versus GFP) for TREM2 plus LPS, and p = 0.0054 (TREM2 versus GFP) for coculture. Four independent experiments were performed.
Figure 4
Figure 4. Migration of TREM2-Transduced Myeloid Cells into EAE Lesions
(A) Detection of invaded myeloid cells in the spinal cord of EAE-diseased mice. Histological sections were obtained at day 2 after intravenous injection of GFP-transduced cells in EAE-diseased mice. Myeloid cells were injected at day 4 after first clinical signs of EAE. Sections were labeled with CD45-specific antibodies. Injected myeloid cells expressed CD45 and accumulated in inflammatory lesions. Scale bar indicates 50 μm. (B) No Iba1 antigen was detected on invaded myeloid cells by double immunofluorescence labeling. GFP+ cells were analyzed in the spinal cord of EAE-diseased mice 4 d after intravenous injection of GFP-transduced myeloid cells. Myeloid cells were applied 4 d after first clinical signs of the disease. Invaded cells showed round appearance, reminiscent of activated macrophage/microglial cells. Scale bar indicates 10 μm. (C) Quantification of cells invaded into the spinal cord of EAE-diseased mice. TREM2-transduced BM-MC or GFP-transduced BM-MC were injected intravenously at day 4 after the first clinical signs of the disease appeared. The BM-MCs migrated into spinal cord lesions within 2 h after intravenous application and remained there for 2–4 d. No GFP+ cells were detected within the spinal cord at day 7 after intravenous application. Data are presented as mean ± SEM. (D) Flow cytometry analysis of TREM2 expression on TREM2-transduced and GFP-transduced myeloid cells obtained from the spinal cord of EAE-diseased mice at day 2 after application. Expression of TREM2 was detected on myeloid cells transduced with TREM2 (red tracing), but not on cells transduced with GFP (green tracing). Tracings shown are from cells gated for GFP. Control antibody isotype is shown as grey-filled tracing. (E) Flow cytometry analysis of CD45 expression on GFP-transduced myeloid cells before injection (green tracing) and on GFP+ cells invaded into the spinal cord (red tracing) at day 4 after injection. Engrafted myeloid cells showed reduced levels of CD45 expression, reminiscent of microglia. Tracings shown are from cells gated for GFP. Control antibody isotype is shown as grey-filled tracing.
Figure 5
Figure 5. Increased Phagocytic Activity and Removal of Degenerated Myelin in the Spinal Cord by TREM2-Transduced Myeloid Cells
(A) Immunostaining of macrophages (MAC3), T cells (CD3), degenerated MBP (dMBP), and Lamp2 in the spinal cord of EAE-diseased mice at day 2 after injection of TREM2-transduced myeloid cells (TREM-BM-MC), GFP-transduced myeloid cells (GFP-BM-MC), or vehicle control (PBS). Cells were injected intravenously in EAE-diseased mice at day 4 after first clinical signs of the disease. Scale bars for MAC3 and CD3 indicate 300 μm. Scale bars for dMBP and Lamp2 indicate 50 μm. (B) Quantification of the number of MAC3- and CD3+ cells, degenerative MBP, and LAMP2-positive cells. EAE-diseased mice were injected at day 4 after first clinical signs of the disease with TREM2-transduced myeloid cells (TREM2-BM-MC), GFP-transduced myeloid cells (GFP-BM-MC), or vehicle control (PBS). At day 2 after cell injection, spinal cords were removed, stained, and analyzed. Macrophages were labeled by MAC3 and T cells by CD3-specific antibodies. Cell therapy by myeloid precursors did not affect the spinal cord immune cell infiltrates. Furthermore, quantification of cells stained for degenerated MBP (dMBP) in the spinal cord of EAE-diseased mice at day 2 after injection was performed, and the amount of degenerated MBP was reduced by cell therapy with TREM2-transduced myeloid cells. Quantification of Lamp2-positive cells (LAMP2) in spinal cord lesions of EAE-diseased mice at day 2 after cell injection was performed. The number of Lamp2-positive cells showing phagocytic activity was increased by the intravenous injection of TREM2-BM-MC. For quantitative analysis, three lumbar spinal cord sections of three mice per group were examined. Data are presented as mean ± SEM. ANOVA, followed by unpaired t-test: p = 0.0422 (TREM2 versus GFP) for dMBP, and p = 0.0069 (TREM2 versus GFP) for LAMP2. (C) Anti-inflammatory cytokine milieu in the spinal cord after treatment with TREM2-transduced myeloid cells. Real-time RT-PCR of cytokines and growth factors at day 6 after first clinical signs of the disease and 2 d after injection of TREM2-transduced myeloid cells (n = 3), control GFP vector–transduced myeloid cells (n = 3), or PBS as vehicle control (n = 3). Relative gene transcript levels of TNFα, IFNγ, and IL-1β were decreased. ANOVA followed by unpaired t-test: p = 0.0324 (TREM2 versus GFP) for TNFα, p = 0.0111 (TREM2 versus PBS) for TNFα, p = 0.0068 (TREM2 versus PBS) for IFNγ, and p = 0.0215 (TREM2 versus PBS) for IL-1β. Each PCR experiment was performed in quadruplicate.
Figure 6
Figure 6. TREM2-Transduced Myeloid Cells Ameliorated EAE
(A) Treatment of EAE-diseased mice by TREM2-transduced myeloid cells at the peak of the disease. Clinical EAE score of mice injected at day 4 after first clinical signs of the disease (arrow) with TREM2-transduced myeloid cells (black tracing), control GFP vector–transduced myeloid cells (green tracing), or PBS (red tracing). Intravenous application of 5 × 10⁶ TREM2-transduced myeloid cells ameliorated the clinical score of EAE. Data are presented as mean ± SD. Mice per group: n = 6 or n = 7. ANOVA followed by unpaired t-test: p = 0.0015 (TREM2 versus GFP) and p = 0.0063 (TREM2 versus PBS) at day 20; p = 0.0045 (TREM2 versus GFP) and p = 0.0046 (TREM2 versus PBS) at day 30. (B) TREM2-transduced myeloid cells injected at the onset of the disease do not affect EAE. Clinical EAE score of mice injected 1 d after the first clinical signs of the disease (arrow) with 5 × 10⁶ TREM2-transduced myeloid cells (black), 5 × 10⁶ control GFP vector–transduced myeloid cells (green), or PBS (red). No effect on the clinical EAE score was observed. Data are presented as mean ± SD. Mice per group: n = 3. (C) Treatment of EAE by TREM2-transduced myeloid cells. Clinical EAE score of mice injected at day 4 after first clinical signs of the disease with 2 × 10⁶ TREM2-transduced myeloid cells (black), 5 × 10⁶ TREM2-transduced myeloid cells (grey), or PBS control (red). Intravenous application of 2 × 10⁶ or 5 × 10⁶ TREM2-transduced myeloid cells ameliorated the clinical score of EAE. Data are presented as mean ± SD. Mice per group: n = 3. ANOVA followed by unpaired t-test: p = 0.0023 (2 × 10⁶ cells versus PBS) and p = 0.0068 (5 × 10⁶ cells versus PBS) at day 20; p = 0.0107 (2 × 10⁶ cells versus PBS) at day 30.
Figure 7
Figure 7. Application of TREM2-Transduced Myeloid Cells Reduced Axonal and Myelin Injury
(A) Reduced spinal cord axonal injury and decreased demyelination after cell therapy by TREM2-transduced myeloid cells. Axonal injury and damage were analyzed by immunostaining with specific antibodies directed against APP and dephosphorylated neurofilament (SMI32) at day 14 after cell application. Demyelination was determined by LFB staining at day 14 after cell application. Mice were injected at day 4 after first clinical signs of EAE by TREM2-transduced myeloid precursor cells (TREM2-BM-MC), GFP-transduced BM-MC (GFP-BM-MC), or PBS control. Representative histological pictures are shown. Scale bars for APP and LFB indicate 200 μm, and for inserts indicate 50 μm. Scale bar for SMI32 indicates 50 μm, and for insert indicates 20 μm. (B) Quantification of axonal damage and demyelination 14 d after cell application in EAE with TREM2-transduced myeloid cells (black bars), control GFP vector–transduced myeloid cells (green bars), or vehicle PBS control (red bars). Level of axonal injury (APP-positive deposits/mm2), axonal damage (relative number of SMI32-positive axons), and demyelination (loss of LFB, as a percentage) were significantly reduced after cell therapy with TREM2-transduced BM-MC. For quantitative analysis, at least three lumbar spinal cord sections of three mice per group were investigated. Data are presented as mean ± SEM. ANOVA followed by unpaired t-test: p = 0.0425 (TREM2 versus GFP) and p = 0.0759 (TREM2 versus PBS) in APP; p = 0.0012 (TREM2 versus GFP) and p = 0.0098 (TREM2 versus PBS) in SMI32; p = 0.0465 (TREM2 versus GFP) and p = 0.00450 (TREM2 versus PBS) in LFB.

Similar articles

Cited by

References

    1. Hickey WF, Kimura H. Perivascular microglial cells of the CNS are bone marrow-derived and present antigen in vivo. Science. 1988;239:290–292. - PubMed
    1. Priller J, Flugel A, Wehner T, Boentert M, Haas CA, et al. Targeting gene-modified hematopoietic cells to the central nervous system: Use of green fluorescent protein uncovers microglial engraftment. Nat Med. 2001;7:1356–1361. - PubMed
    1. Simard AR, Rivest S. Bone marrow stem cells have the ability to populate the entire central nervous system into fully differentiated parenchymal microglia. FASEB J. 2004;18:998–1000. - PubMed
    1. Flugel A, Bradl M, Kreutzberg GW, Graeber MB. Transformation of donor-derived bone marrow precursors into host microglia during autoimmune CNS inflammation and during the retrograde response to axotomy. J Neurosci Res. 2001;66:74–82. - PubMed
    1. Bechmann I, Goldmann J, Kovac AD, Kwidzinski E, Simburger E, et al. Circulating monocytic cells infiltrate layers of anterograde axonal degeneration where they transform into microglia. FASEB J. 2005;19:647–649. - PubMed

Publication types

MeSH terms