

Expression of c-kit and Sca-1 and their relationship with multidrug resistance protein 1 in mouse bone marrow mononuclear cells
- PMID: 17425603
- PMCID: PMC2265919
- DOI: 10.1111/j.1365-2567.2007.02547.x
Expression of c-kit and Sca-1 and their relationship with multidrug resistance protein 1 in mouse bone marrow mononuclear cells
Abstract
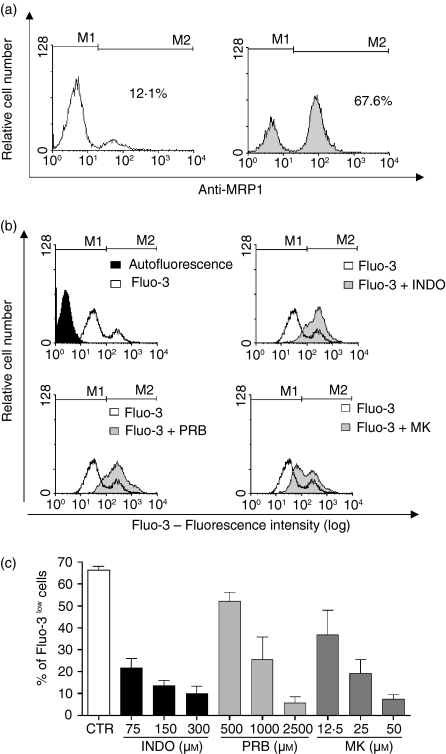
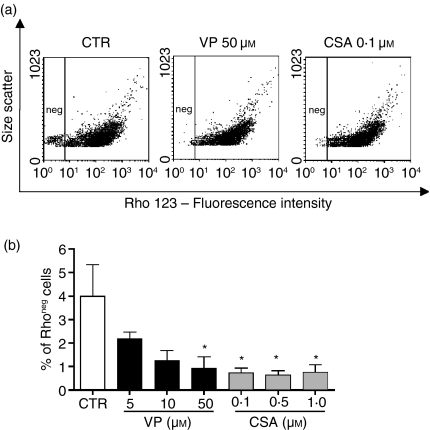
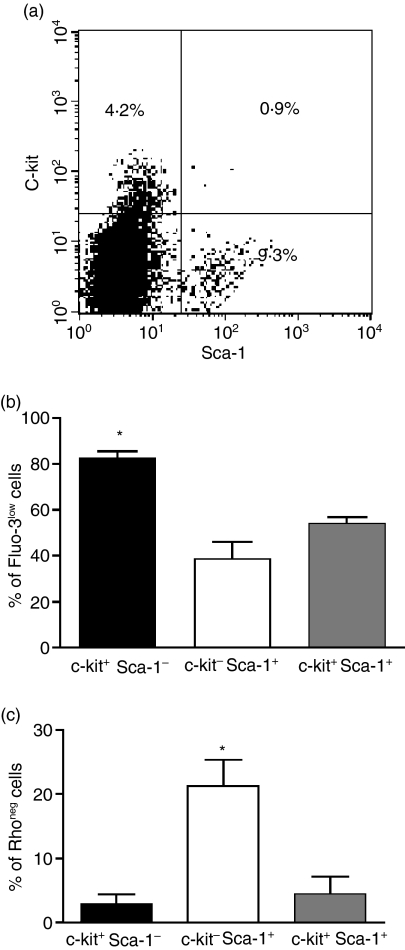
P-glycoprotein (Pgp) and multidrug resistance protein 1 (MRP1) are members of the ATP-binding cassette (ABC) family of transporter proteins. Both molecules are membrane-associated, energy-dependent efflux pumps with different substrate selectivity and they may play a role in the activation, differentiation and function of haematopoietic cells. Mouse haematopoietic cells are characterized by the expression of the cell surface molecules c-kit and Sca-1. Herein, the presence and activities of Pgp and MRP1 in mouse bone marrow mononuclear cells (BMMC) and their relationship with the proteins c-kit and Sca-1 were evaluated. Pgp and MRP activities were measured based on the extrusion of rhodamine 123 (for Pgp) and Fluo-3 (for MRP). Cell populations were assessed by cytometry using anti-c-kit and anti-Sca1 antibodies. Pgp activity was present in 5% of BMMC while 50% of BMMC cells showed MRP activity. These findings agreed with the proportion of cells expressing the MRP1 surface molecule (51.3 +/- 4.17%). About 14% of BMMC were positive for c-kit and/or Sca-1 (9.3% c-kit- Sca-1+, 4.2% c-kit+ Sca-1- and 0.9% c-kit+ Sca-1+). Among these subpopulations only c-kit- Sca-1+ cells presented Pgp activity (21.36%). On the other hand, MRP activity was present in all three subpopulations. Most cells (82.5%) of the c-kit+ Sca-1- subpopulation presented MRP1 activity compared to only 54.1% of c-kit+ Sca-1+ and 38.8% of c-kit- Sca-1+. This study demonstrates the expression and activity of MRP1 in BMMC. While only a small proportion of precursor cells had Pgp activity, MRP1 activity was present among different subpopulations of precursor cells. Further studies are necessary to establish the role of these transporters in haematopoietic cells.
Figures
Similar articles
-
Evaluation of Sca-1 and c-Kit as selective markers for muscle remodelling by nonhemopoietic bone marrow cells.Stem Cells. 2007 Jun;25(6):1364-74. doi: 10.1634/stemcells.2006-0194. Epub 2007 Feb 15. Stem Cells. 2007. PMID: 17303817
-
A systemic provascular response in bone marrow to musculoskeletal trauma in mice.J Bone Joint Surg Br. 2007 Jan;89(1):116-20. doi: 10.1302/0301-620X.89B1.18222. J Bone Joint Surg Br. 2007. PMID: 17259429
-
Differential expression of alpha2 integrin separates long-term and short-term reconstituting Lin-/loThy1.1(lo)c-kit+ Sca-1+ hematopoietic stem cells.Stem Cells. 2006 Apr;24(4):1087-94. doi: 10.1634/stemcells.2005-0396. Epub 2005 Dec 22. Stem Cells. 2006. PMID: 16373693
-
Detection of hematopoietic stem cells by flow cytometry.Methods Cell Biol. 2011;103:21-30. doi: 10.1016/B978-0-12-385493-3.00002-4. Methods Cell Biol. 2011. PMID: 21722798 Review.
-
Contribution of efflux pump activity to the delivery of pulmonary therapeutics.Curr Drug Metab. 2002 Feb;3(1):1-12. doi: 10.2174/1389200023338170. Curr Drug Metab. 2002. PMID: 11876574 Review.
Cited by
-
Stem cell factor induces polarization of microglia to the neuroprotective phenotype in vitro.Heliyon. 2018 Oct 1;4(10):e00837. doi: 10.1016/j.heliyon.2018.e00837. eCollection 2018 Oct. Heliyon. 2018. PMID: 30294687 Free PMC article.
-
Inhibition of glycosphingolipid biosynthesis reverts multidrug resistance by differentially modulating ABC transporters in chronic myeloid leukemias.J Biol Chem. 2020 May 8;295(19):6457-6471. doi: 10.1074/jbc.RA120.013090. Epub 2020 Mar 30. J Biol Chem. 2020. PMID: 32229586 Free PMC article.
-
P-glycoprotein and drug resistance in systemic autoimmune diseases.Int J Mol Sci. 2014 Mar 20;15(3):4965-76. doi: 10.3390/ijms15034965. Int J Mol Sci. 2014. PMID: 24658440 Free PMC article. Review.
-
Cancer cell resistance mechanisms: a mini review.Clin Transl Oncol. 2014 Jun;16(6):511-6. doi: 10.1007/s12094-014-1162-1. Epub 2014 Mar 20. Clin Transl Oncol. 2014. PMID: 24647842 Review.
-
P-glycoprotein and chronic rhinosinusitis.World J Otorhinolaryngol Head Neck Surg. 2018 Aug 24;4(3):169-174. doi: 10.1016/j.wjorl.2018.07.002. eCollection 2018 Sep. World J Otorhinolaryngol Head Neck Surg. 2018. PMID: 30506047 Free PMC article. Review.
References
-
- Gottesman MM, Ling V. The molecular basis of multidrug resistance in cancer. The early years of P-glycoprotein research. FEBS Lett. 2006;580:998–1009. - PubMed
-
- Cole SPC, Bhardwaj G, Gerlach JH, et al. Overexpression of a transporter gene in a multidrug-resistant human lung cancer cell line. Science. 1992;258:1650–4. - PubMed
-
- Deeley RG, Cole SP. Substrate recognition and transport by multidrug resistance protein 1 (ABCC1) FEBS Lett. 2006;580:1103–11. - PubMed
-
- Leslie EM, Deeley RG, Cole SP. Multidrug resistance proteins. Role of P-glycoprotein, MRP1, MRP2, and BCRP (ABCG2) in tissue defense. Toxicol Appl Pharmacol. 2005;204:216–37. - PubMed
-
- MacDonald HPR, Bommhardt U, Cerottini JC. Developmentally regulated expression of P-glycoprotein (multidrug resistance) activity in mouse thymocytes. Eur J Immunol. 1995;25:1457–60. - PubMed
Publication types
MeSH terms
Substances
LinkOut - more resources
Full Text Sources
Research Materials
Miscellaneous
