

Randomized exposure-controlled trials; impact of randomization and analysis strategies
- PMID: 17425629
- PMCID: PMC2000645
- DOI: 10.1111/j.1365-2125.2007.02887.x
Randomized exposure-controlled trials; impact of randomization and analysis strategies
Abstract
Aims: In the literature, five potential benefits of randomizing clinical trials on concentration levels, rather than dose, have been proposed: (i) statistical study power will increase; (ii) study power will be less sensitive to high variability in the pharmacokinetics (PK); (iii) the power of establishing an exposure-response relationship will be robust to correlations between PK and pharmacodynamics (PD); (iv) estimates of the exposure-response relationship are likely to be less biased; and (v) studies will provide a better control of exposure in situations with toxicity issues. The main aim of this study was to investigate if these five statements are valid when the trial results are evaluated using a model-based analysis.
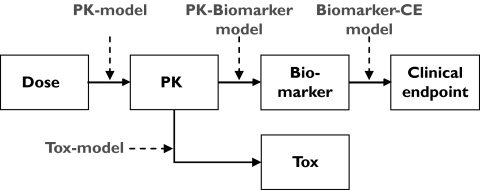
Methods: Quantitative relationships between drug dose, concentration, biomarker and clinical end-point were defined using pharmacometric models. Three randomization schemes for exposure-controlled trials, dose-controlled (RDCT), concentration-controlled (RCCT) and biomarker-controlled (RBCT), were simulated and analysed according to the models.
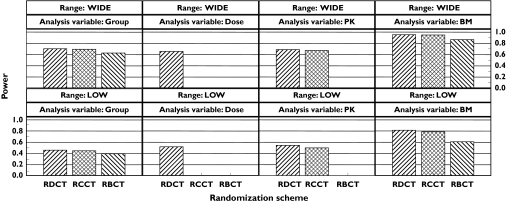
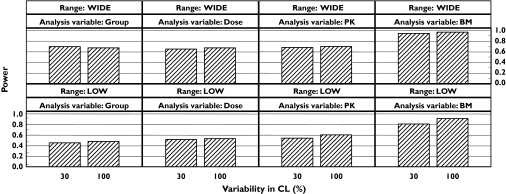
Results: (i) The RCCT and RBCT had lower statistical power than RDCT in a model-based analysis; (ii) with a model-based analysis the power for an RDCT increased with increasing PK variability; (iii) the statistical power in a model-based analysis was robust to correlations between CL and EC(50) or E(max); (iv) under all conditions the bias was negligible (<3%); and (v) for studies with equal power RCCT could produce either more or fewer adverse events compared with an RDCT.
Conclusion: Alternative randomization schemes may not have the proposed advantages if a model-based analysis is employed.
Figures
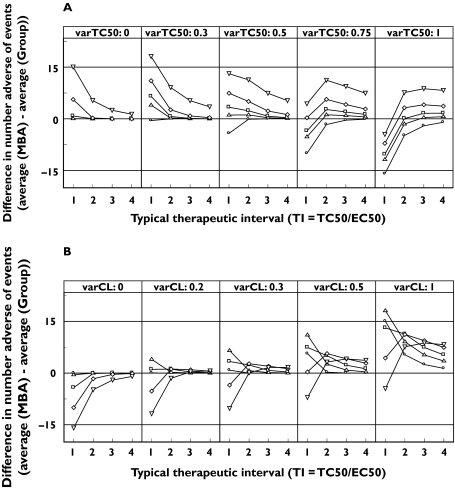
 , 0 varCL;
  , 0.2 varCL;
  , 0.3 varCL;
  , 0.5 varCL;
  , 0 varTC50) and (b) CL (
 , 0 varTC50;
  , 0.3 varTC50;
  , 0.5 varTC50;
  , 0.75 varTC50;
  , 1 varTC50). The variability is noted as the CV.
Similar articles
-
Comparative efficiencies of randomized concentration- and dose-controlled clinical trials.Clin Pharmacol Ther. 1994 Sep;56(3):331-8. doi: 10.1038/clpt.1994.144. Clin Pharmacol Ther. 1994. PMID: 7924129
-
Concentration-controlled or effect-controlled trials: useful alternatives to conventional dose-controlled trials?Clin Pharmacokinet. 2001;40(5):317-25. doi: 10.2165/00003088-200140050-00001. Clin Pharmacokinet. 2001. PMID: 11432535 Review.
-
The randomized concentration-controlled trial: an evaluation of its sample size efficiency.Control Clin Trials. 1991 Dec;12(6):780-94. doi: 10.1016/0197-2456(91)90041-j. Control Clin Trials. 1991. PMID: 1665119
-
Weighted re-randomization tests for minimization with unbalanced allocation.Pharm Stat. 2013 Jul-Aug;12(4):243-53. doi: 10.1002/pst.1577. Epub 2013 Jun 13. Pharm Stat. 2013. PMID: 23760923
-
Methodological issues of randomized controlled trials for the evaluation of reproductive health interventions.Prev Med. 1996 May-Jun;25(3):365-75. doi: 10.1006/pmed.1996.0067. Prev Med. 1996. PMID: 8781015 Review.
Cited by
-
Rapid sample size calculations for a defined likelihood ratio test-based power in mixed-effects models.AAPS J. 2012 Jun;14(2):176-86. doi: 10.1208/s12248-012-9327-8. Epub 2012 Feb 17. AAPS J. 2012. PMID: 22350626 Free PMC article.
-
Recent advances in the ontogeny of drug disposition.Br J Clin Pharmacol. 2022 Oct;88(10):4267-4284. doi: 10.1111/bcp.14821. Epub 2021 Apr 15. Br J Clin Pharmacol. 2022. PMID: 33733546 Free PMC article. Review.
-
Dose-Response Mixed Models for Repeated Measures - a New Method for Assessment of Dose-Response.Pharm Res. 2020 Jul 31;37(8):157. doi: 10.1007/s11095-020-02882-0. Pharm Res. 2020. PMID: 32737604 Free PMC article.
-
Pharmacometrics-Based Considerations for the Design of a Pharmacogenomic Clinical Trial Assessing Irinotecan Safety.Pharm Res. 2021 Apr;38(4):593-605. doi: 10.1007/s11095-021-03024-w. Epub 2021 Mar 17. Pharm Res. 2021. PMID: 33733372 Free PMC article.
-
Adaptive trials in paediatric development: dealing with heterogeneity and uncertainty in pharmacokinetic differences in children.Br J Clin Pharmacol. 2012 Aug;74(2):346-53. doi: 10.1111/j.1365-2125.2012.04187.x. Br J Clin Pharmacol. 2012. PMID: 22256787 Free PMC article.
References
-
- Kraiczi H, Jang T, Ludden T, Peck CC. Randomized concentration-controlled trials: motivations, use, and limitations. Clin Pharmacol Ther. 2003;74:203–14. - PubMed
-
- Sanathanan LP, Peck CC. The randomized concentration-controlled trial: an evaluation of its sample size efficiency. Control Clin Trials. 1991;12:780–94. - PubMed
-
- Grahnen A, Karlsson MO. Concentration-controlled or effect-controlled trials: useful alternatives to conventional dose-controlled trials? Clin Pharmacokinet. 2001;40:317–25. - PubMed
-
- Department of Health and Human Services. CDER and CBER guidance for industryExposure–Response Relationships—Study Design, Data Analysis, and Regulatory Applications. 2003. [2005-May-16]. Available from http://www.fda.gov/cber/gdlns/exposure.pdf.
-
- Karlsson MO, Jonsson EN, Wiltse CG, Wade JR. Assumption testing in population pharmacokinetic models: illustrated with an analysis of moxonidine data from congestive heart failure patients. J Pharmacokinet Biopharm. 1998;26:207–46. - PubMed
Publication types
MeSH terms
LinkOut - more resources
Full Text Sources
