. 2007 Aug 15;110(4):1168-77.
doi: 10.1182/blood-2007-01-066282. Epub 2007 Apr 10.

Regulation of COX-2 mediated signaling by alpha3 type IV noncollagenous domain in tumor angiogenesis

Affiliations

Regulation of COX-2 mediated signaling by alpha3 type IV noncollagenous domain in tumor angiogenesis

Chandra Shekhar Boosani et al. Blood. .

Abstract

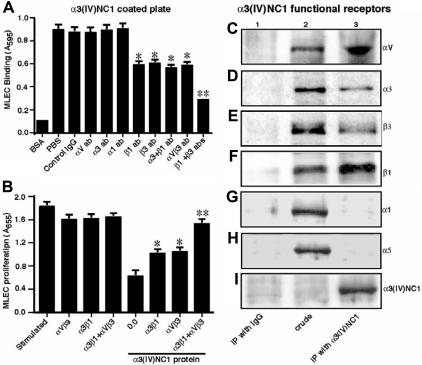
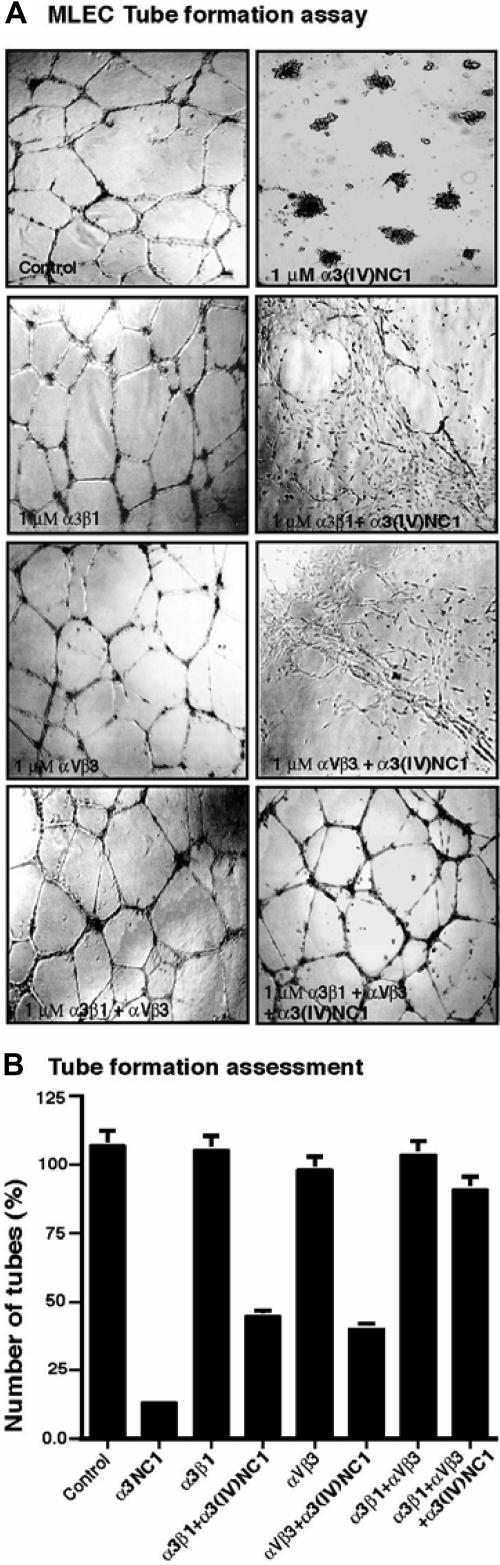
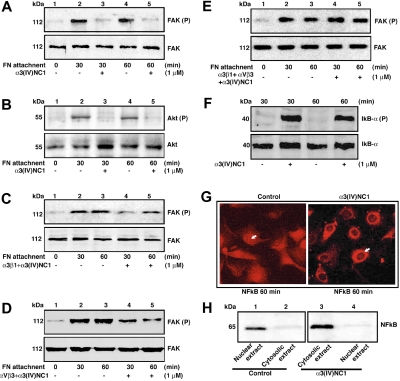
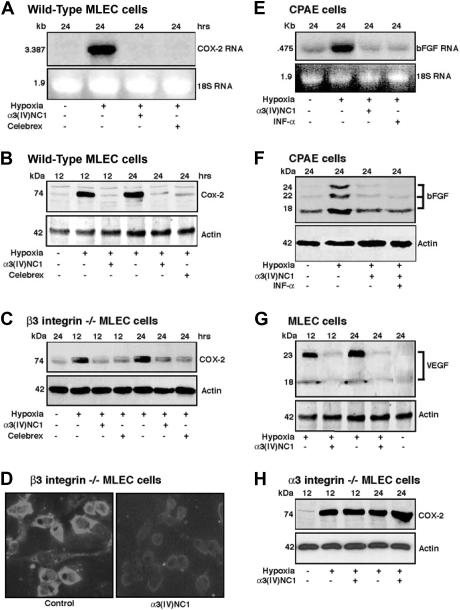
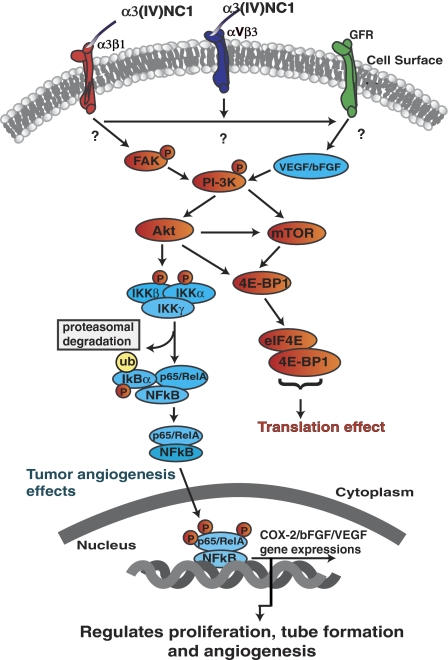
Human alpha3 chain, a noncollagenous domain of type IV collagen [alpha3(IV)NC1], inhibits angiogenesis and tumor growth. These biologic functions are partly attributed to the binding of alpha3(IV)NC1 to alphaVbeta3 and alpha3beta1 integrins. alpha3(IV)NC1 binds alphaVbeta3 integrin, leading to translation inhibition by inhibiting focal adhesion kinase/phosphatidylinositol 3-kinase/Akt/mTOR/4E-BP1 pathways. In the present study, we evaluated the role of alpha3beta1 and alphaVbeta3 integrins in tube formation and regulation of cyclooxygenase-2 (COX-2) on alpha3(IV)NC1 stimulation. We found that although both integrins were required for the inhibition of tube formation by alpha3(IV)NC1 in endothelial cells, only alpha3beta1 integrin was sufficient to regulate COX-2 in hypoxic endothelial cells. We show that binding of alpha3(IV)NC1 to alpha3beta1 integrin leads to inhibition of COX-2-mediated pro-angiogenic factors, vascular endothelial growth factor, and basic fibroblast growth factor by regulating IkappaBalpha/NFkappaB axis, and is independent of alphaVbeta3 integrin. Furthermore, beta3 integrin-null endothelial cells, when treated with alpha3(IV)NC1, inhibited hypoxia-mediated COX-2 expression, whereas COX-2 inhibition was not observed in alpha3 integrin-null endothelial cells, indicating that regulation of COX-2 by alpha3(IV)NC1 is mediated by integrin alpha3beta1. Our in vitro and in vivo findings demonstrate that alpha3beta1 integrin is critical for alpha3(IV)NC1-mediated inhibition of COX-2-dependent angiogenic signaling and inhibition of tumor progression.


Figures

Figure 1
Figure 1
Blocking of integrin β1 and β3 inhibits adhesion to α3(IV)NC1 domain. (A) Cell adhesion assay. MLECs were seeded onto a 96-well plate coated with α3(IV)NC1 in the presence of the indicated integrin antibodies and cell adhesion was evaluated. Values are means (± the standard error of the mean [SEM]) of triplicate wells. Differences between 3 independent experiments control IgG and various integrin antibodies treated cells binding were significant. *P < .05 and **P < .01. (B) Proliferation assay. Similar to panel A, cells were preincubated with indicated integrin proteins with and without α3(IV)NC1 and cell proliferation was evaluated. The results are shown as mean (± the standard error of the mean [SEM]) *P < .05, α3(IV)NC1 without vs with α3β1 and αVβ3 integrins. **P < .008, α3(IV)NC1 without vs with α3β1 + αVβ3 integrins together. (C-I) Identification of α3(IV)NC1 functional binding integrins. MLECs were treated with α3(IV)NC1 for approximately 6 hours and extracts were immunoprecipitated with anti-α3(IV)NC1 antibody or control IgG. Immunoprecipitates were fractionated by SDS-PAGE and immunoblotted with anti-α3(IV)NC1, αV, α3, β3, β1, α1, and α5 antibodies. Crude cell lysate was used as a positive control.
Figure 2
Figure 2
Tube formation assays. (A) Tube formation assay on matrigel was studied with or without α3(IV)NC1 and with different integrins (α3β1, αVβ3, or α3β1+αVβ3), with and without α3(IV)NC1 protein. Tube formation was evaluated after 48 hours using a Leitz Fluovert microscope (100×/1.25 NA), and representative fields were shown. Images were captured using a Flex Digital IEEE-1394 camera (Sheerin Scientific) and processed using SPOT advanced imaging software version 3.1.0 (Diagnostic Instruments, Sterling Heights, MI) and Adobe Photoshop 7.0 (Adobe, Redmond, WA). (B) Tube assay graphical representation. Average number of tubes formed (% values, with error bars indicating SEM) in 3 independent experiments is shown in the graph.
Figure 3
Figure 3
FAK and AKT phosphorylation. Serum-starved wild-type MLECs were plated on FN-coated dishes in incomplete medium (ICM) supplemented with and without α3(IV)NC1 or α3β1+α3(IV)NC1 or αVβ3+α3(IV)NC1, or α3β1+αVβ3+α3(IV)NC1, for 0 to 60 minutes and cytosolic extracts were analyzed by Western immunoblotting. (A) Immunoblots of phosphorylated FAK (p-FAK, upper blot) and total signaling FAK protein (FAK, lower blot). (B) Phosphorylated AKT (p-AKT, upper blot) and total signaling AKT protein (AKT lower blot). (C-E) Similar to panels A and B but with and without α3(IV)NC1 or α3β1+α3(IV)NC1, or αVβ3+α3(IV)NC1, or α3β1+αVβ3+α3(IV)NC1. (F-H) Regulation of IκB-α and NFκB in ECs by α3(IV)NC1. (F) Hypoxic cell extracts were immunoblotted with phosphorylated IκB-α (p-IκB-α, upper blot) and total IκB-α protein (lower blot). (G) Nuclear translocations of NFκB staining in MLECs were determined using a Zeiss LSM 510 Meta Confocal microscope (Carl Zeiss) with a Plan-Neo 63×/1.4 NA objective lens. Images were captured using a Flex Digital IEEE-1394 camera (Sheerin Scientific), and processed using SPOT advanced imaging software version 3.1.0 (Diagnostic Instruments) and Adobe Photoshop 7.0 (Adobe). (H) Immunoblots of cytosolic and nuclear extracts showing the NFκB translocation.
Figure 4
Figure 4
Regulation of COX-2–mediated signaling by α3(IV)NC1 in hypoxic ECs. (A) Autoradiogram showing expression of COX-2 mRNA on α3(IV)NC1 treatment. Celecoxib was used as a positive control. (B) Western immunoblot of MLEC extracts using antibodies specific to COX-2. (C) β3 integrin-null MLEC extracts were analyzed by Western blotting using antibodies specific to COX-2. (D) MLECs treated with and without α3(IV)NC1 were exposed to hypoxia for approximately 12 hours and stained with COX-2 antibody. Images were viewed using a Zeiss AX10 microscope (Carl Zeiss) with a 40×/0.75 NA objective lens, captured using a Flex Digital IEEE-1394 camera (Sheerin Scientific), and processed using SPOT advanced imaging software version 3.1.0 (Diagnostic Instruments) and Adobe Photoshop 7.0 (Adobe). (E) Autoradiogram showing expression of bFGF mRNA on α3(IV)NC1 treatment in cow pulmonary artery ECs. The top half of the autoradiogram (0.475 bFGF probe) shows inhibition of expression of bFGF mRNA on treatment with α3(IV)NC1 or IFN-α (positive control). (F,G) Similar to panel B, cow pulmonary artery ECs and MLEC extracts were immunoblotted with antibodies specific for bFGF and VEGF. (H) α3 integrin-null ECs were treated with α3(IV)NC1 and exposed to hypoxic conditions and cell extracts were immunoblotted with COX-2 antibody. 18S RNA (A,E) and actin (B,C,F-H) levels were shown as loading controls.
Figure 5
Figure 5
In vivo matrigel plug and tumor angiogenesis in 129/Sv mice. (A) From left to right, control, bFGF, bFGF+α3(IV)NC1, VEGF, VEGF+α3(IV)NC1. E indicates ECs; M, matrigel; SM, smooth muscle. Scale bar: 40 μm. Arrows point to the blood vessels. The number of blood vessels in the matrigel plugs was counted in 10 fields at ×200 magnification. Images were viewed using a Zeiss AX10 camera (Carl Zeiss) with a 100×/1.4 NA objective lens, captured using a Flex Digital IEEE-1394 camera (Sheerin Scientific), and processed using SPOT advanced imaging software 3.1.0 (Diagnostic Instruments) and Adobe Photoshop 7.0 (Adobe). (B,C) Number of blood vessels and Hb content quantification from panel A. The mean (± SEM) are shown. *P < .01, VEGF with vs without α3(IV)NC1. **P < .01, bFGF with vs without α3(IV)NC1. (D) The graph of the growth of mice tumors with and without α3(IV)NC1 injections. The results are shown as mean (± SEM). P < .005, tumor mice without α3(IV)NC1 injection as control group. (E) The average tumor weights of different groups shown in panel D. (F) Frozen sections (4-μm) from different tumor tissues were stained with anti-CD31 antibody and the number of CD31-positive blood vessels were counted. Blood vessel quantification results are shown as the mean (± SEM). *P < .005, mice with vs without α3(IV)NC1 treatment. (G) The circulating VEGFR2-positive cells in the blood of tumor-bearing mice, quantification results are shown as the mean (± SEM). *P < .005, mice with vs without α3(IV)NC1 treatment. (H) Frozen sections from different tumor tissues were stained with anti–COX-2 and CD31 antibodies, followed by FITC rhodamine-conjugated secondary antibodies. CD31 and COX-2 merged positive blood vessels were shown (arrow) in 6 fields at 200× magnification. Images were viewed, captured, and processed as described for panel A. Scale bar: 50 μm.
Figure 6
Figure 6
Schematic illustration of different signaling pathway mediated by α3(IV)NC1. α3(IV)NC1 binds to αVβ3 and α3β1 integrins and inhibit phosphorylation of FAK. Inhibition of FAK activation leads to inhibition of FAK/phosphatidylinositol 3-kinase/eIF4E/4E-BP1. In addition, α3(IV)NC1 also inhibits NFκB-mediated signaling in hypoxic conditions leads to inhibition of COX-2/VEGF/bFGF expressions, resulting in inhibition of hypoxic tumor angiogenesis.

References

    1. Folkman J, D'Amore PA. Blood vessel formation: what is its molecular basis? Cell. 1996;87:1153–1155. - PubMed
    1. Distler O, Neidhart M, Gay RE, Gay S. The molecular control of angiogenesis. Int Rev Immunol. 2002;21:33–49. - PubMed
    1. Tryggvason K, Hoyhtya M, Pyke C. Type IV collagenases in invasive tumors. Breast Cancer Res Treat. 1993;24:209–218. - PubMed
    1. Folkman J. Angiogenesis in cancer, vascular, rheumatoid and other disease. Nat Med. 1995;1:27–31. - PubMed
    1. Carmeliet P, Jain RK. Angiogenesis in cancer and other diseases. Nature. 2000;407:249–257. - PubMed

Publication types

MeSH terms