

WTH3 is a direct target of the p53 protein
- PMID: 17426708
- PMCID: PMC2359938
- DOI: 10.1038/sj.bjc.6603724
WTH3 is a direct target of the p53 protein
Abstract
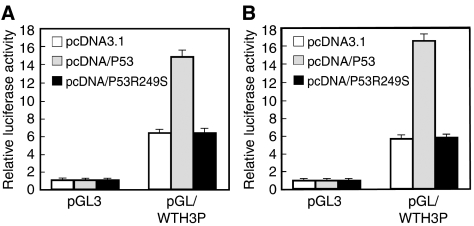
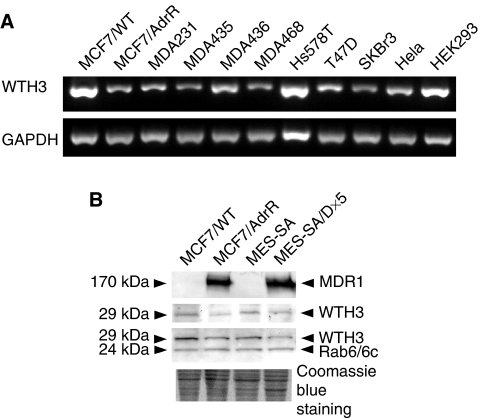
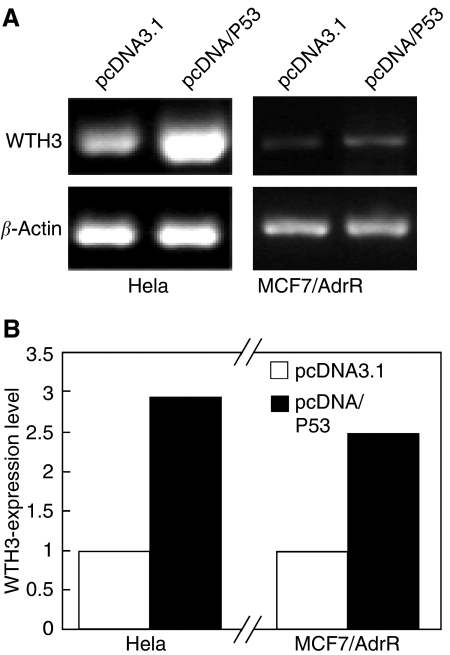
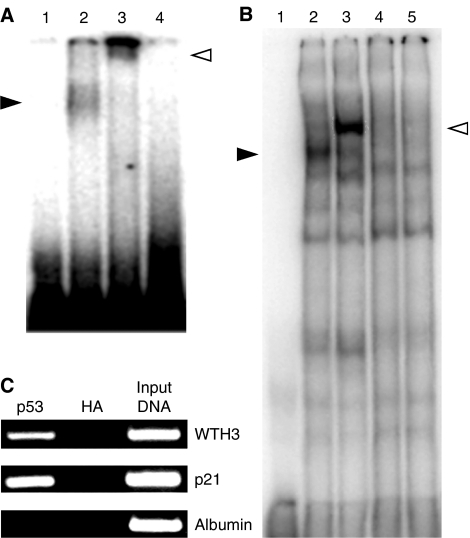
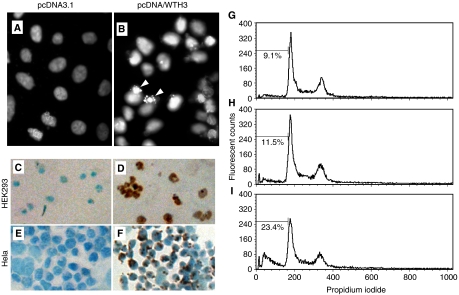
Previous results showed that overexpression of the WTH3 gene in multidrug resistance (MDR) cells reduced MDR1 gene expression and converted their resistance to sensitivity to various anticancer drugs. The WTH3 gene promoter was found to be differentially regulated in paired MDR vs non-MDR MCF7 cells owing to epigenetic modifications and transcription factor modulations. To understand further the mechanisms that govern WTH3's differential expression, we uncovered a p53-binding site in its promoter, which indicated that WTH3 could be regulated by the p53 gene. This hypothesis was then tested by different strategies. The resulting data revealed that (1) the WTH3 promoter was upregulated by the p53 transgene in diverse host cells; (2) there was a correlation between WTH3 expression levels and p53 gene status in a cell line panel; (3) a WTH3 promoter region was directly targeted by the p53 protein in vitro and in vivo. In addition, overexpression of the WTH3 gene promoted the apoptotic phenotype in host cells. On the basis of these findings, we believe that the negative role played by the WTH3 gene in MDR development is through its proapoptotic potential that is regulated by multiple mechanisms at the transcription level, and one of these mechanisms is linked to the p53 gene.
Figures

Similar articles
-
Methylation of WTH3, a possible drug resistant gene, inhibits p53 regulated expression.BMC Cancer. 2008 Nov 7;8:327. doi: 10.1186/1471-2407-8-327. BMC Cancer. 2008. PMID: 18992151 Free PMC article.
-
WTH3, which encodes a small G protein, is differentially regulated in multidrug-resistant and sensitive MCF7 cells.Cancer Res. 2005 Aug 15;65(16):7421-8. doi: 10.1158/0008-5472.CAN-05-0658. Cancer Res. 2005. PMID: 16103095
-
Epigenetic regulation of WTH3 in primary and cultured drug-resistant breast cancer cells.Cancer Res. 2005 Nov 1;65(21):10024-31. doi: 10.1158/0008-5472.CAN-05-1944. Cancer Res. 2005. PMID: 16267028
-
WTH3, a new member of the Rab6 gene family, and multidrug resistance.Biochim Biophys Acta. 2002 Apr 3;1589(2):112-23. doi: 10.1016/s0167-4889(02)00164-7. Biochim Biophys Acta. 2002. PMID: 12007787
-
Living with p53, dying of p53.Cell. 2007 Aug 24;130(4):597-600. doi: 10.1016/j.cell.2007.08.005. Cell. 2007. PMID: 17719538 Review.
Cited by
-
Establishment and characterization of a bona fide Barrett esophagus-associated adenocarcinoma cell line.Cancer Biol Ther. 2008 Nov;7(11):1753-5. doi: 10.4161/cbt.7.11.6723. Epub 2008 Nov 4. Cancer Biol Ther. 2008. PMID: 18787394 Free PMC article.
-
Low RAB6C expression is a predictor of tamoxifen benefit in estrogen receptor-positive/progesterone receptor-negative breast cancer.Mol Clin Oncol. 2020 May;12(5):415-420. doi: 10.3892/mco.2020.2014. Epub 2020 Mar 9. Mol Clin Oncol. 2020. PMID: 32257197 Free PMC article.
-
Methylation of WTH3, a possible drug resistant gene, inhibits p53 regulated expression.BMC Cancer. 2008 Nov 7;8:327. doi: 10.1186/1471-2407-8-327. BMC Cancer. 2008. PMID: 18992151 Free PMC article.
-
RAB6C is an independent prognostic factor of estrogen receptor-positive/progesterone receptor-negative breast cancer.Oncol Lett. 2020 Jan;19(1):52-60. doi: 10.3892/ol.2019.11109. Epub 2019 Nov 19. Oncol Lett. 2020. PMID: 31897114 Free PMC article.
-
Expression of WTH3 in breast cancer tissue and the effects on the biological behavior of breast cancer cells.Exp Ther Med. 2015 Jul;10(1):154-158. doi: 10.3892/etm.2015.2458. Epub 2015 Apr 29. Exp Ther Med. 2015. PMID: 26170927 Free PMC article.
References
-
- Aas T, Borresen AL, Geisler S, Smith-Sorensen B, Johnsen H, Varhaug JE, Akslen LA, Lonning PE (1996) Specific P53 mutations are associated with de novo resistance to doxorubicin in breast cancer patients. Nat Med 2: 811–814 - PubMed
-
- Adachi K, Toyota M, Sasaki Y, Yamashita T, Ishida S, Ohe-Toyota M, Maruyama R, Hinoda Y, Saito T, Imai K, Kudo R, Tokino T (2004) Identification of SCN3B as a novel p53-inducible proapoptotic gene. Oncogene 23: 7791–7798 - PubMed
-
- Antequera F, Bird A (1993a) CpG islands. Exs 64: 169–185 - PubMed
-
- Barbacid M (1987) ras genes. Annu Rev Biochem 56: 779–827 - PubMed
Publication types
MeSH terms
Substances
Grants and funding
LinkOut - more resources
Full Text Sources
Molecular Biology Databases
Research Materials
Miscellaneous
