. 2007 Apr 11;2(4):e366.
doi: 10.1371/journal.pone.0000366.

Human GLI3 intragenic conserved non-coding sequences are tissue-specific enhancers

Affiliations

Human GLI3 intragenic conserved non-coding sequences are tissue-specific enhancers

Amir Ali Abbasi et al. PLoS One. .

Abstract

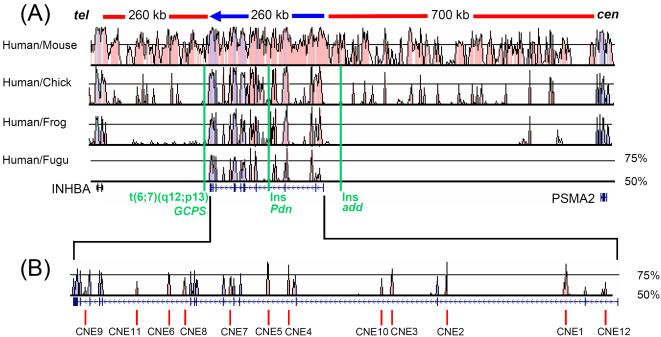
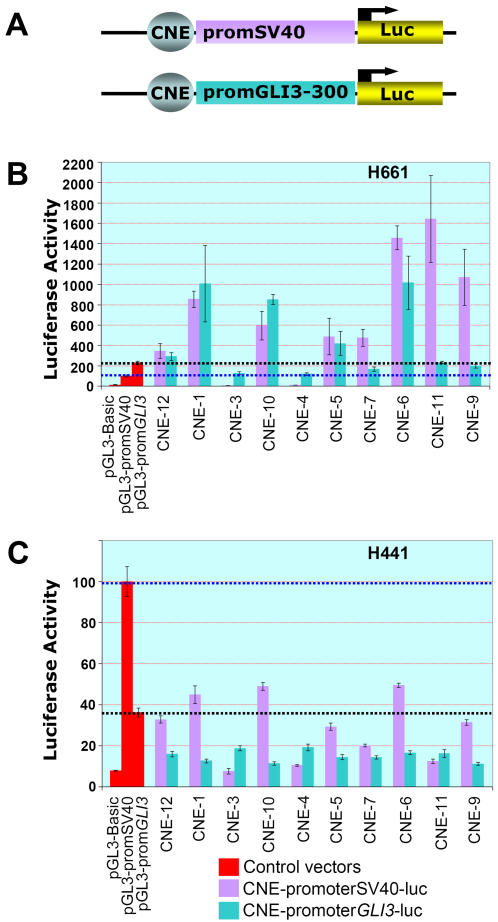
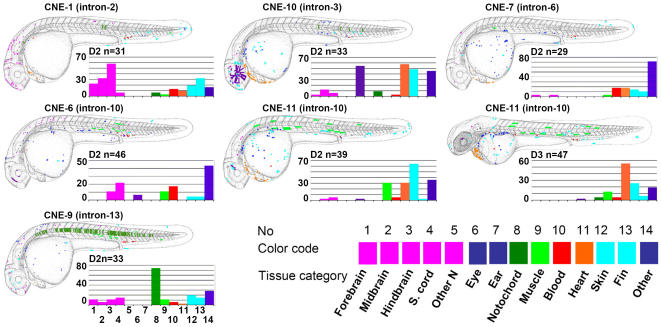
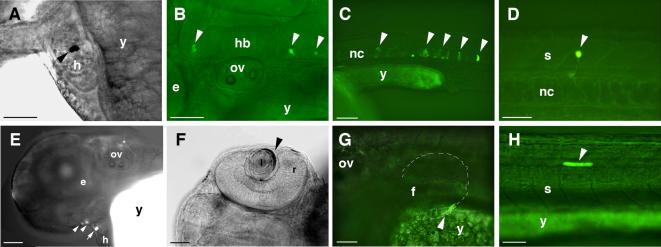
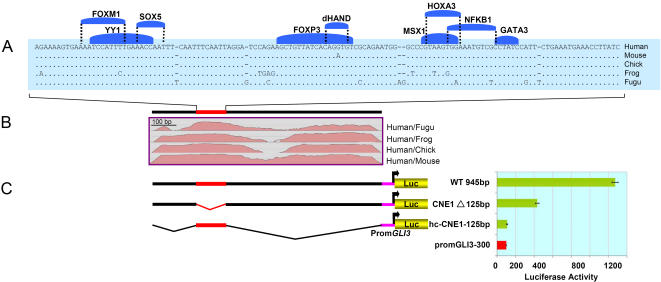
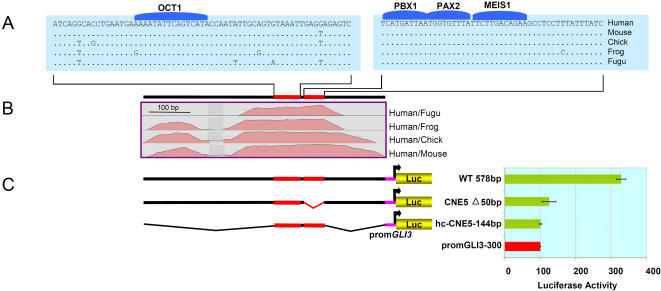
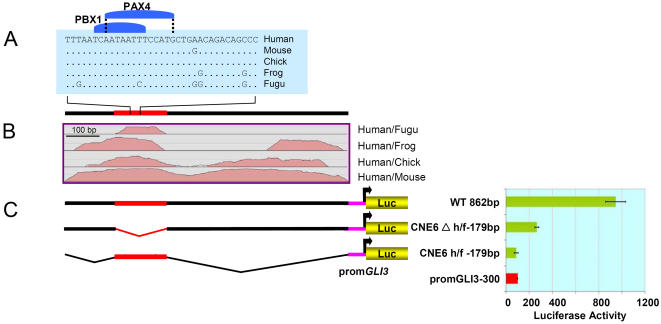
The zinc-finger transcription factor GLI3 is a key regulator of development, acting as a primary transducer of Sonic hedgehog (SHH) signaling in a combinatorial context dependent fashion controlling multiple patterning steps in different tissues/organs. A tight temporal and spatial control of gene expression is indispensable, however, cis-acting sequence elements regulating GLI3 expression have not yet been reported. We show that 11 ancient genomic DNA signatures, conserved from the pufferfish Takifugu (Fugu) rubripes to man, are distributed throughout the introns of human GLI3. They map within larger conserved non-coding elements (CNEs) that are found in the tetrapod lineage. Full length CNEs transiently transfected into human cell cultures acted as cell type specific enhancers of gene transcription. The regulatory potential of these elements is conserved and was exploited to direct tissue specific expression of a reporter gene in zebrafish embryos. Assays of deletion constructs revealed that the human-Fugu conserved sequences within the GLI3 intronic CNEs were essential but not sufficient for full-scale transcriptional activation. The enhancer activity of the CNEs is determined by a combinatorial effect of a core sequence conserved between human and teleosts (Fugu) and flanking tetrapod-specific sequences, suggesting that successive clustering of sequences with regulatory potential around an ancient, highly conserved nucleus might be a possible mechanism for the evolution of cis-acting regulatory elements.


Conflict of interest statement

Competing Interests: The authors have declared that no competing interests exist.

Figures

Figure 1
Figure 1
Comparative Sequence Analysis of the GLI3 Locus Detects Conserved Non-coding Sequence Elements. (A) Sequence alignments of the genomic interval containing the human GLI3 locus and flanking human genes INHBA and PSMA2 with orthologous counterparts from representative members of rodent, bird, amphibian, and fish lineages. These are shown as SLAGAN derived VISTA representations. Conserved coding sequences are depicted in blue and conserved non-coding sequences are in pink. Criteria of alignment were 60 bp window and 50% conservation cutoff. Conservation between human and Fugu (scaffold_210 ENSEMBL genome browser) is restricted to the GLI3 gene. Red bars above the conservation plot depict the approximate length of intergenic regions flanking human GLI3. The blue arrow shows the length of the GLI3 gene and the direction of transcription. A graphic representation showing exons and introns of GLI3 is shown below the homology plot. Green vertical lines indicate the positions of alterations affecting the genomic structure of the locus which result in loss of GLI3 function: a translocation event associated with Greig cephalopolysyndactyly syndrome (GCPS) , and two insertions (ins) in mouse mutants anterior digit pattern deformity (add) , and polydactyly Nagoya (Pdn) . (B) Magnified view of the human/Fugu conservation plot and the genomic structure of human GLI3. The red vertical bars below the plot show the position of human/Fugu highly conserved non-coding sequence elements (CNEs) that were functionally tested as putative enhancers.
Figure 2
Figure 2
CNEs Regulate Luciferase Reporter Gene Expression in Transiently Transfected Human Cell Lines. (A) Diagrams of the reporter constructs employed to test the regulatory potential of CNEs from the introns of human GLI3. CNEs were cloned into in a pGL3-Basic vector containing either a minimal GLI3 promoter (pGL3-CNE-promGLI3-300-luc) or a heterologous SV40 promoter (pGL3-CNE promSV40-luc) upstream of a firefly luciferase gene. (B) Luciferase activity of reporter constructs in human H661 cells that express endogenous GLI3. (C) Luciferase activity of reporter constructs in human H441 cells that do not express endogenous GLI3. The pGL3-Basic vector, with no promoter/enhancer insert was used as a negative control. Luciferase activity in cells transiently transfected with the positive control, a construct containing a SV40 promoter upstream of the reporter gene (pGL3-promSV40-luc), was taken as 100% (blue dotted line). A plasmid expressing Renilla luciferase was co-transfected as a standard for transcription efficiency. Average firefly luciferase reporter activities relative to Renilla luciferase activity from three triplicate transfection experiments are depicted as percentage of activity obtained with the positive control vector (B, C). Standard errors of the mean are shown. Black dotted lines indicate the luciferase expression level reached in each cell line with the pGL3-promGLI3-300-luc vector.
Figure 3
Figure 3
Sites of GFP Expression Induced by GLI3-Associated CNEs in Zebrafish Embryos. Upregulation of GFP by individual GLI3-associated CNEs (indicated by name and location in a GLI3-intron) depicted in schematic representations of day two, 24–33 hpf (D2) or day 3 (D3) embryos. N = the total number of positive embryos per CNE. Categories of cell type that were positive for a given element are color coded, and each dot represents a single GFP positive cell. These are mapped onto camera lucida drawings of the zebrafish embryo, and the overall results are overlaid. The percentage of positive embryos that show expression in each color coded tissue category are shown on the bar charts.
Figure 4
Figure 4
Tissue Type Specific Expression of GFP Reporter Gene in Zebrafish Embryos. Examples of GFP expression induced by CNEs 1, 9, 10, and 11 are shown in fixed tissues after wholemount anti-GFP immunostaining (bright field views A and F) or in live embryos by combined bright field and GFP fluorescence microscopy analyses (B, C, D, E, G and H). Arrowheads indicate GFP expressing cells. Embryos C and D are ∼26–33 hpf, while embryos A, B, E, F, G, and H are 48–54 hpf. Lateral views, anterior to the left and dorsal to the top except for F where the dorsal view is shown. GFP positive cells were found in the following: (A) CNE1, heart chamber (B) CNE1, hindbrain neurons (C) CNE9, notochord (D) CNE9, spinal cord neuron (E) CNE10, lower jaw primordia and pericardial regions (F) CNE10, lens epithelial cell layer (G) CNE11, pectoral fin (H) CNE11, muscle. (e) Eye; (f) fin; (h) heart; (hb) hindbrain; (I) lens; (nc) notochord; (ov) otic vesicle; (r) retina; (s) spinal cord; (y) yolk.
Figure 5
Figure 5
Deletion Analysis Reveals a Critical Role of hc-CNE1-125bp for the Regulatory Potential of CNE1. (A) BLASTZ alignment of a human, mouse, chick, frog, and Fugu highly-conserved 125 bp sequence fragment embedded within CNE1 shown with predicted conserved TFBSs (above). (B) SLAGAN alignment plots of human, mouse, chick, frog and Fugu CNE1 using human sequence as the base line. (C) Architecture of CNE1 wild type and deletion constructs, The red bar depicts the highly conserved region, and less well conserved regions are shown in black. Luciferase activity obtained in H661 cells after transient transfection of reporter constructs is shown in the diagram at the right side. Reporter gene expression is driven by CNE1 fragments upstream of the human GLI3 minimal promoter. The red bar depicts luciferase expression (100%) in H661 cells driven alone by the control GLI3 minimal promoter (Prom-GLI3-300), while green bars represent the activity recorded for the vectors containing experimental reporter constructs.
Figure 6
Figure 6
Putative Binding Sites for Individual Trans-Acting Factors are Necessary but not Sufficient for Activating Potential of CNE5. (A) BLASTZ alignment of highly conserved fragments embedded within CNE5 along with predicted conserved TFBSs. (B) CNE5 alignment plot of human, mouse, chick, frog and Fugu sequences using human sequence as the base line. (C) Architecture of wild type and deletion constructs; the red portion of the bar depicts the highly conserved human/fish regions. Luciferase activity obtained in H661cells after transient transfection of reporter constructs is shown in the diagram at the right side. Reporter gene expression is driven by CNE5 fragments upstream of the human GLI3 minimal promoter. The red bar depicts luciferase expression (100%) in H661 cells driven alone by the control GLI3 minimal promoter (PromGLI3-300), while the green bars represent the activity recorded for the vectors containing experimental reporter constructs, i.e. wild type CNE5 (wt 578bp), CNE5 with deleted PBX1, PAX2 and MEIS1 binding module (CNE5Δ50bp), and the 144 bp fragment (hcCNE5-144bp). Deletion of the 50 bp fragment almost entirely extinguishes the strong activating potential of CNE5. The isolated 144 bp fragment cannot activate expression.
Figure 7
Figure 7
CNE6 Sequences Flanking Human/Fish conserved Track Show Residual Enhancer Activity. (A) BLASTZ alignment of the highest conserved 35 bp along with two predicted conserved TFBSs from the human/Fugu conserved block within CNE6. (B) CNE6 alignment plot of human, mouse, chick, frog and Fugu sequences using human sequence as the base line. (C) Architecture of wild type and deletion constructs; the red bar depicts the highly conserved human/fish segment. Luciferase activity obtained in H661 cells after transient transfection of reporter constructs is shown in the diagram at the right side. Reporter gene expression is driven by CNE5 fragments upstream of the human GLI3 minimal promoter. The red bar depicts luciferase expression (100%) in H661 cells driven alone by the control GLI3 minimal promoter (PromGLI3-300), whilst the green bars represent the activity recorded for the vectors containing experimental reporter constructs, i.e. wild type CNE6 (wt 862bp), CNE6 with deleted human/Fugu conserved block (CNE6Δh/f-179bp), and the 72% human/fish conserved fragment (CNE6h/f-179bp). CNE6Δh/f-179bp can still enhance reporter gene transcription more than two-fold. The isolated 179 bp fragment cannot activate expression.

References

    1. Radhakrishna U, Bornholdt D, Scott HS, Patel UC, Rossier C, et al. The phenotypic spectrum of GLI3 morphopathies includes autosomal dominant preaxial polydactyly type-IV and postaxial polydactyly type-A/B; No phenotype prediction from the position of GLI3 mutations. Am J Hum Genet. 1999;65:645–655. - PMC - PubMed
    1. Vortkamp A, Gessler M, Grzeschik KH. GLI3 zinc-finger gene interrupted by translocations in Greig syndrome families. Nature. 1991;352:539–540. - PubMed
    1. Wild A, Kalff-Suske M, Vortkamp A, Bornholdt D, Konig R, et al. Point mutations in human GLI3 cause Greig syndrome. Hum Mol Genet. 1997;6:1979–1984. - PubMed
    1. Kalff-Suske M, Wild A, Topp J, Wessling M, Jacobsen EM, et al. Point mutations throughout the GLI3 gene cause Greig cephalopolysyndactyly syndrome. Hum Mol Genet. 1999;8:1769–1777. - PubMed
    1. Kang S, Graham JM, Jr, Olney AH, Biesecker LG. GLI3 frameshift mutations cause autosomal dominant Pallister-Hall syndrome. Nat Genet. 1997;15:266–268. - PubMed

Publication types

MeSH terms