Large deformation diffeomorphism and momentum based hippocampal shape discrimination in dementia of the Alzheimer type
- PMID: 17427733
- PMCID: PMC2848689
- DOI: 10.1109/TMI.2005.853923
Large deformation diffeomorphism and momentum based hippocampal shape discrimination in dementia of the Alzheimer type
Abstract
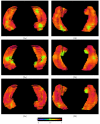
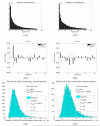
In large-deformation diffeomorphic metric mapping (LDDMM), the diffeomorphic matching of images are modeled as evolution in time, or a flow, of an associated smooth velocity vector field v controlling the evolution. The initial momentum parameterizes the whole geodesic and encodes the shape and form of the target image. Thus, methods such as principal component analysis (PCA) of the initial momentum leads to analysis of anatomical shape and form in target images without being restricted to small-deformation assumption in the analysis of linear displacements. We apply this approach to a study of dementia of the Alzheimer type (DAT). The left hippocampus in the DAT group shows significant shape abnormality while the right hippocampus shows similar pattern of abnormality. Further, PCA of the initial momentum leads to correct classification of 12 out of 18 DAT subjects and 22 out of 26 control subjects.
Figures


References
-
- Grenander U, Miller MI. Computational anatomy: An emerging discipline. Quart. Appl. Math. 1998 Dec.vol. LVI:617–694.
-
- Csernansky JG, Wang L, Joshi SC, Ratnanather JT, Miller MI. Computational anatomy and neuropsychiatric disease: Probabilistic assessment of variation and statistical inference of group difference, hemispheric asymmetry, and time-dependent change. NeuroImage. 2004;vol. 23:S56–S68. - PubMed
-
- Csernansky JG, Wang L, Joshi S, Miller JP, Gado M, Kido D, McKeel D, Morris JC, Miller MI. Early dat is distinguished from aging by high-dimensional mapping of the hippocampus. Neurology. 2000;vol. 55(no. 11):1636–1643. - PubMed
-
- Wang L, Swank JS, Glick IE, Gado MH, Miller MI, Morris JC, Csernansky JG. Changes in hippocampal volume and shape across time distinguish dementia of the alzheimer type from healthy aging. NeuroImage. 2003;vol. 20(no. 2):667–682. - PubMed
-
- Csernansky JG, Hamstra J, Wang L, McKeel D, Price JL, Gado M, Morris JC. Correlations between antemortem hippocampal volume and postmortem neuropathology in AD subjects. Alzheimer Dis. Assoc. Disord. 2004;vol. 18(no. 4):190–195. - PubMed
Publication types
MeSH terms
Grants and funding
- R01-MH60883/MH/NIMH NIH HHS/United States
- R01 MH064838/MH/NIMH NIH HHS/United States
- R01 MH056584/MH/NIMH NIH HHS/United States
- AG05684/AG/NIA NIH HHS/United States
- R01 AG025824/AG/NIA NIH HHS/United States
- R01-MH56584/MH/NIMH NIH HHS/United States
- P50-AG05681/AG/NIA NIH HHS/United States
- P41 RR015241/RR/NCRR NIH HHS/United States
- P41-RR15241/RR/NCRR NIH HHS/United States
- R01-AG025824/AG/NIA NIH HHS/United States
- P01-AG03991/AG/NIA NIH HHS/United States
- P01 AG003991/AG/NIA NIH HHS/United States
- P50 AG005681/AG/NIA NIH HHS/United States
- R01 MH060883/MH/NIMH NIH HHS/United States
- P50-MH71616/MH/NIMH NIH HHS/United States
- P50 MH071616/MH/NIMH NIH HHS/United States
- P41 EB015909/EB/NIBIB NIH HHS/United States
- F32 AG005684/AG/NIA NIH HHS/United States
- R01-MH064838/MH/NIMH NIH HHS/United States
LinkOut - more resources
Full Text Sources
Other Literature Sources
Medical

