Comparative Study
. 2007;8(4):R53.
doi: 10.1186/gb-2007-8-4-r53.

Comparative genomics using Fugu reveals insights into regulatory subfunctionalization

Affiliations
Comparative Study

Comparative genomics using Fugu reveals insights into regulatory subfunctionalization

Adam Woolfe et al. Genome Biol. 2007.

Abstract

Background: A major mechanism for the preservation of gene duplicates in the genome is thought to be mediated via loss or modification of cis-regulatory subfunctions between paralogs following duplication (a process known as regulatory subfunctionalization). Despite a number of gene expression studies that support this mechanism, no comprehensive analysis of regulatory subfunctionalization has been undertaken at the level of the distal cis-regulatory modules involved. We have exploited fish-mammal genomic alignments to identify and compare more than 800 conserved non-coding elements (CNEs) that associate with genes that have undergone fish-specific duplication and retention.

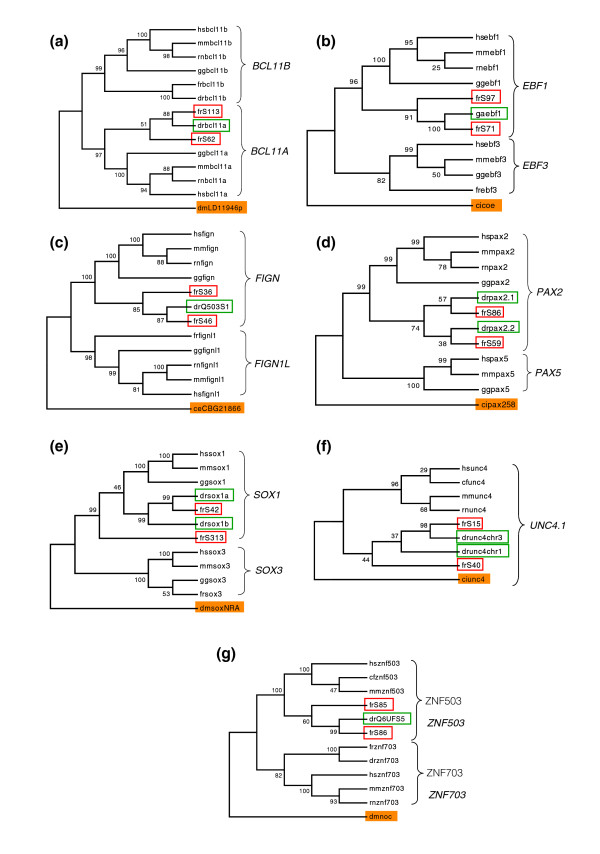
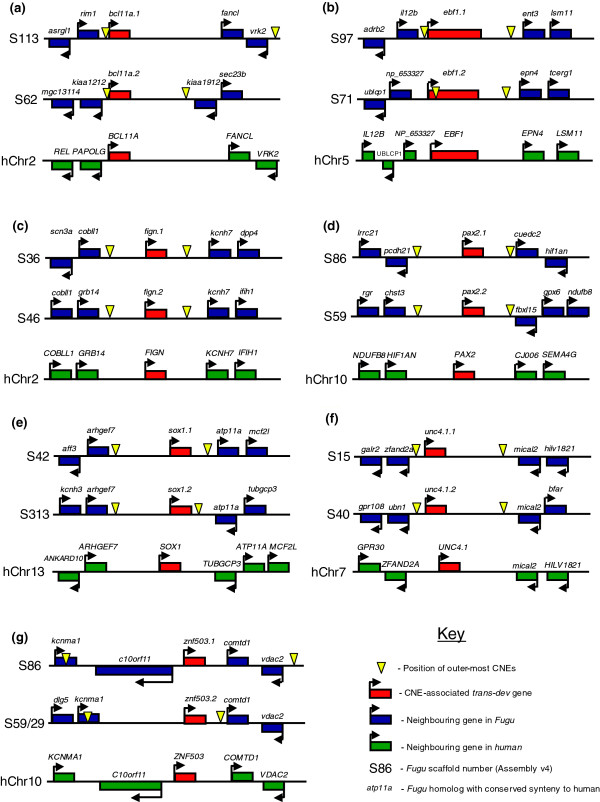
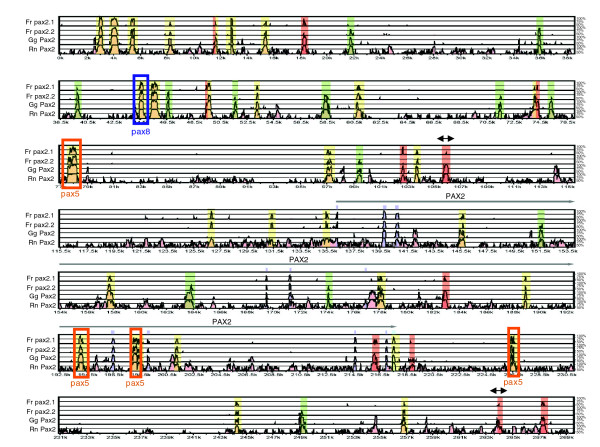
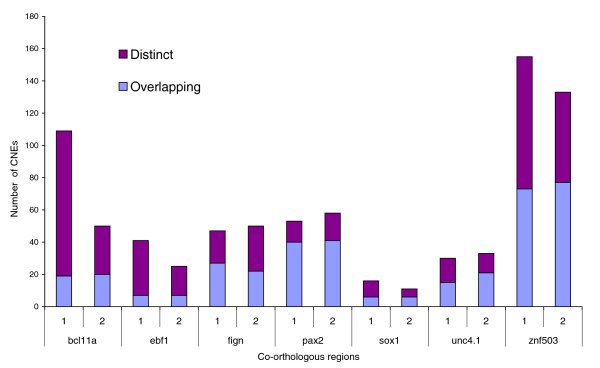
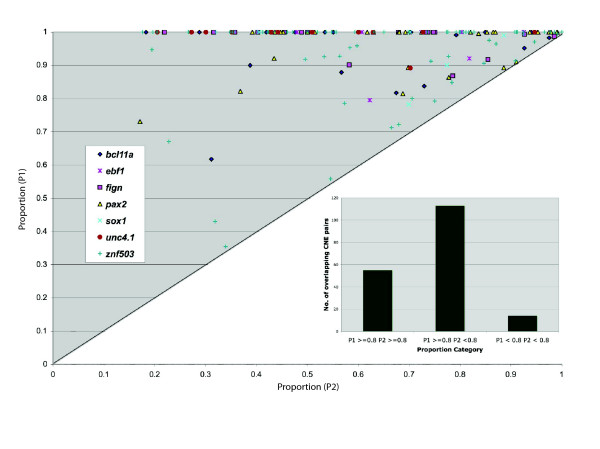
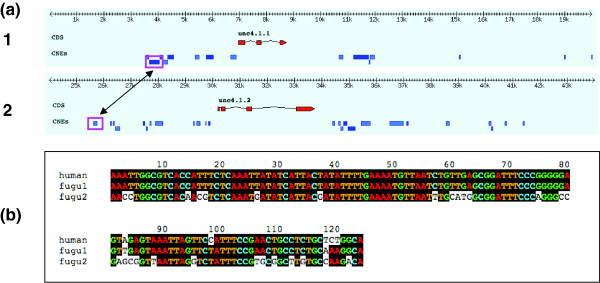
Results: Using the abundance of duplicated genes within the Fugu genome, we selected seven pairs of teleost-specific paralogs involved in early vertebrate development, each containing clusters of CNEs in their vicinity. CNEs present around each Fugu duplicated gene were identified using multiple alignments of orthologous regions between single-copy mammalian orthologs (representing the ancestral locus) and each fish duplicated region in turn. Comparative analysis reveals a pattern of element retention and loss between paralogs indicative of subfunctionalization, the extent of which differs between duplicate pairs. In addition to complete loss of specific regulatory elements, a number of CNEs have been retained in both regions but may be responsible for more subtle levels of subfunctionalization through sequence divergence.

Conclusion: Comparative analysis of conserved elements between duplicated genes provides a powerful approach for studying regulatory subfunctionalization at the level of the regulatory elements involved.


Figures

Figure 1
Figure 1
Phylogenies of seven Fugu co-orthologs. Fugu (fr) co-ortholog protein sequences are highlighted by red boxes and named according to scaffold number they were located on (for example, frS86 = scaffold_86). Zebrafish (dr) or stickleback (ga) sequences are highlighted by green boxes and uncharacterized proteins named after the SwissProt ID or the chromosome they are located on. Bootstrap values are indicated at each node. Other tetrapod sequences included: human (hs), mouse (mm), rat (rn), dog (cf) and chicken (gg). Invertebrate outgroups are shaded orange and contain sequences from the following species: Ciona intestinalis (ci), Drosophila melanogaster (dm) and Caenhoribditis elegans (ce). Trees: (a) BCL11A using the closest paralog BCL11B as a comparator. (b) EBF1 using the closest paralog EBF3 as a comparator. (c) FIGN using the closest paralog FIGN1L as a comparator. (d) PAX2 using one of its two closest paralogs PAX5 as a comparator. (e) SOX1 using its closest paralog SOX3 as a comparator. (f) UNC4.1 has no known closely related paralogs. (g) ZNF503 using its closest paralog ZNF703 as a comparator.
Figure 2
Figure 2
Genomic environment around Fugu co-orthologs in comparison to the human ortholog. Diagrammatic representation of the genomic environment around Fugu co-orthologs and human orthologs of: (a) BCL11A, (b) EBF1, (c) FIGN, (d) PAX2, (e) SOX1, (f) UNC4.1 and (g) ZNF503. For each gene, the top two lines represent the genic environment around each of the Fugu co-orthologs whilst the third line represents the genic environment around the human ortholog. Regions are not drawn to scale and are representative only. Human chromosome locations and Fugu scaffold IDs are stated to the left of each graphic. Fugu scaffold IDs can be cross-referenced for their exact location through Table 1. All annotation was retrieved from Ensembl Fugu (v36.4) and Human (v.36.35i). Only genes that are conserved in both Fugu and human are shown. Reference trans-dev genes are colored in red and are always orientated in 5'→3' orientation. Surrounding genes in Fugu are marked in blue and in human in green. The names of neighboring Fugu homologs that share conserved synteny with human (but not necessarily the same relative order or orientation) are highlighted in an orange box. Genes orientated in the same direction as the reference trans-dev gene are located above the line and those orientated in the opposite direction are below the line. Yellow triangles represent the positions of the furthest CNEs upstream and downstream in each genomic sequence and delineate the region in which CNEs were identified.
Figure 3
Figure 3
VISTA plot of an MLAGAN alignment of orthologous regions surrounding two pax2 co-orthologs in Fugu (Fr) and Pax2 in chicken (Gg), rat (Rn) and human. The baseline is 268 kb of human sequence. Conservation between human and each sequence is shown as a peak. Peaks that represent conservation in a non-coding region of at least 65% over 40 bp are shaded pink with coding exons shaded purple and peaks located within untranslated regions shaded light-blue. All CNEs conserved in at least one of the Fugu co-orthologs are color-coded. CNEs in both Fugu co-orthologs that overlap the same region in human are shaded yellow while CNEs that are 'distinct' (or conserved solely) in pax2.1 are shaded red and CNEs distinct to pax2.2 are shaded green. Peaks marked with a double-headed arrow are conserved in Fugu in the opposite orientation (and therefore do not show up in the VISTA plot). A number of the CNEs around PAX2 are also duplicated CNEs (dCNEs) that are located elsewhere in the genome in the vicinity of PAX2 paralogs. CNEs marked with an orange box have another dCNE family member in the vicinity of PAX5 and the CNE marked with a blue box has a dCNE family member conserved upstream of PAX8.
Figure 4
Figure 4
Proportion of CNEs around each Fugu co-ortholog that overlap or are distinct to sequences in mammals compared to CNEs identified in its counterpart co-ortholog. Each bar represents the total number of CNEs identified around each co-ortholog with a proportion of that total colored as overlapping (light purple) or distinct (maroon) CNEs.
Figure 5
Figure 5
Proportion of each CNE sequence that overlaps the counterpart co-ortholog CNE. Main graph: for each overlapping pair of co-orthologous CNEs (involving just two sequences), the proportion of the full length of each CNE (P1-P2) made up by the overlap was calculated using the human sequence as the reference. The larger of the two proportions was always plotted as P1 to simplify analysis. Inset bar chart: summary of the number of overlapping CNE pairs falling into three main proportion categories: P1 ≥ 0.8, P2 ≥ 0.8 - pairs that overlapped over the majority of both elements, suggesting little evolution of element length since duplication; P1 ≥ 0.8, P2 < 0.8 - pairs that have undergone significant degeneration in element length in one of the copies compared to its counterpart; P1 < 0.8, P2 < 0.8 - pairs that have undergone a level of degeneration in element length in both copies at their edges.
Figure 6
Figure 6
Significant change in element length and substitution rate in overlapping CNEs upstream of unc4.1.1 and unc4.1.2. (a) CNEs (filled blue boxes) were identified around each Fugu co-ortholog unc4.1.1 (A1, top) and unc4.1.2 (A2, bottom) (gene exons are shown in the coding sequence (CDS) track as filled red boxes). The scale at the top represents positions along the Fugu sequence used in the multiple alignment. Two CNEs, highlighted in pink boxes, one upstream of Fugu unc4.1.1 (CRCNEAC00031954 [53], referred to as CNE_A1) and one upstream of unc4.1.2 (CRCNEAC00032205 [53], referred to as CNE_A2) are conserved to part of the same sequence in human upstream of UNC4.1. The overlap region is 126 bp in length and encompasses all of the CNE_A2 but only 35% of CNE_A1 (which is 360 bp long), indicating a significant loss of element length in CNE_A2. (b) A relative rate test of the Fugu CNEs across the overlapping region using human as the outgroup reveals a highly significant number of independent substitutions (26) in CNE_A2 with no independent substitutions in CNE_A1 (p < 0.001). This suggests CNE_A1 is likely to have retained the ancestral function while CNE_A2 may have evolved to have a different function.

Similar articles

Cited by

References

    1. Lynch M, Conery JS. The evolutionary fate and consequences of duplicate genes. Science. 2000;290:1151–1155. doi: 10.1126/science.290.5494.1151. - DOI - PubMed
    1. Ohno S. Evolution by Gene Duplication. Heidelberg: Springer-Verlag; 1970.
    1. Nowak MA, Boerlijst MC, Cooke J, Smith JM. Evolution of genetic redundancy. Nature. 1997;388:167–171. doi: 10.1038/40618. - DOI - PubMed
    1. Nadeau JH, Sankoff D. Comparable rates of gene loss and functional divergence after genome duplications early in vertebrate evolution. Genetics. 1997;147:1259–1266. - PMC - PubMed
    1. Amores A, Force A, Yan YL, Joly L, Amemiya C, Fritz A, Ho RK, Langeland J, Prince V, Wang YL, et al. Zebrafish hox clusters and vertebrate genome evolution. Science. 1998;282:1711–1714. doi: 10.1126/science.282.5394.1711. - DOI - PubMed

Publication types

LinkOut - more resources