. 2007 Jul 7;247(1):23-35.
doi: 10.1016/j.jtbi.2007.02.017. Epub 2007 Mar 12.

Modeling the mechanisms of acute hepatitis B virus infection

Affiliations

Modeling the mechanisms of acute hepatitis B virus infection

Stanca M Ciupe et al. J Theor Biol. .

Abstract

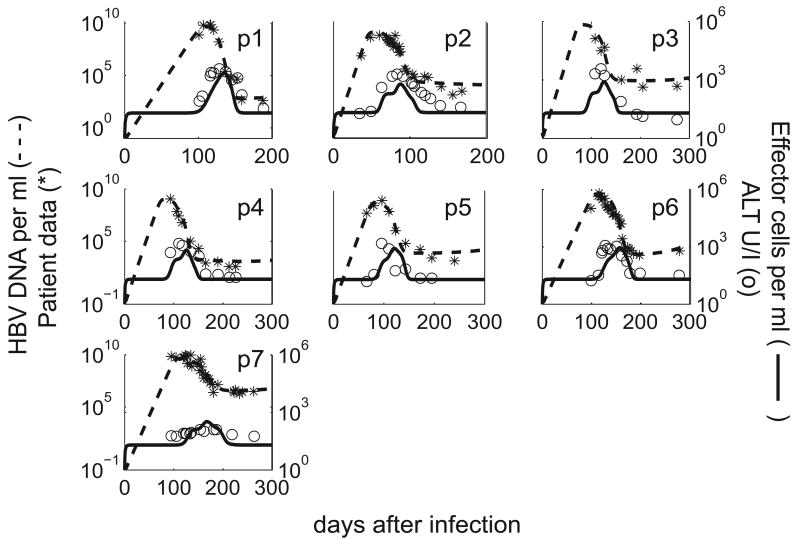
Mathematical models have been used to understand the factors that govern infectious disease progression in viral infections. Here we focus on hepatitis B virus (HBV) dynamics during the acute stages of the infection and analyze the immune mechanisms responsible for viral clearance. We start by presenting the basic model used to interpret HBV therapy studies conducted in chronically infected patients. We then introduce additional models to study acute infection where immune responses presumably play an important role in determining whether the infection will be cleared or become chronic. We add complexity incrementally and explain each step of the modeling process. Finally, we validate the model against experimental data to determine how well it represents the biological system and, consequently, how useful are its predictions. In particular, we find that a cell-mediated immune response plays an important role in controlling the virus after the peak in viral load.


Figures

Figure 1
Figure 1
The decay of HBV-DNA virus titer during acute infection of one patient.
Figure 2
Figure 2
Results of fitting the model given by equation (1) to the data for patient 6. We use the initial conditions given in Table 1 and fit all the parameters, except λ = dT0. The results predict viral steady state levels higher than observed and a poor fit to the data at the peak. The results are characteristic of all patients.
Figure 3
Figure 3
Results of fitting the model to each patient's HBV DNA data and the relationship between effector cells and serum ALT during the acute phase of the infection. The best fit of the model (dashed line) to HBV DNA patient data (*). The measured serum ALT (o), which was not used in data fitting, compares well with the predicted dynamics of the HBV-specific CD8+ T-cell response (solid line). Note that the peak of the effector cell response occurs after 90% viral load reduction.
Figure 4
Figure 4
Infected hepatocyte levels (fraction of Ttotal). The number of cells with one cccDNA, I1, (dashed lines) is smaller than the number of cells with multiple, I2, cccDNA (solid lines). The dash-dotted line represents the total number, I1 + I2, of infected cells as a fraction of the total number of hepatocytes.
Figure 5
Figure 5
Best fit of the model given by equation (2) (solid line) and the model with multiple infectious events (dashed line) to the data (*).
Figure 6
Figure 6
Best fit of the model given by equation (2) (solid line) and the model with recovery rates dependent on effector cells (dashed line) to the data (*).
Figure 7
Figure 7
Results of fitting the model with one class of infected cells to the data. The best fit of the model (dashed line) to HBV DNA patient data (*). The measured serum ALT (o), which was not used in data fitting, compares well with the predicted dynamics of the HBV-specific CD8+ T-cell response (solid line).
Figure 8
Figure 8
Results from fitting the model given by equation (4) (dashed lines) to the data (*). We note a worse match of the measured serum ALT (o), which was not used in data fitting and the predicted HBV-specific CD8+ T-cells (solid line).
Figure 9
Figure 9
Results of fitting model given by equation (2) (solid line) to the data (*) and the total hepatocytes as percent of Tmax (dashed line) for r = 0.1 day−1, r = 1 day−1, and r = 0 5 day−1. Hepatocyte destruction is reduced when we allow for higher proliferation rates. Results are presented for patients 2 and 7.
Figure 10
Figure 10
Results of fitting model given by equation (2) with µ = 0 (dashed line) to the data (*).

References

    1. Ahmed R, Gray D. Immunologycal memory and protective immunity: understanding their relation. Science. 1996;272:54–60. - PubMed
    1. Asano M, Ahmed R. CD8 T cell memory in B cell-deficient mice. J Exp Med. 1996;183:2165–2174. - PMC - PubMed
    1. Banks HT, Fitzpatrick BG. Statistical methods for model comparison in parameter estimation problems for distributed systems. J Math Biol. 1990;28:501–527.
    1. Boer RD, Oprea M, Antia R, Murali-Krishna K, Ahmed R, Perelson A. Recruitment times, proliferation, and apoptosis rates during the CD8+ T-cell response to lymphocytic choriomeningitis virus. J Virol. 2001;75:10663–10669. - PMC - PubMed
    1. Butz E, Bevan MJ. Massive expansion of antigen-specific CD8+ T cells during an acute virus infection. Immunity. 1998;8:167–175. - PMC - PubMed

Publication types

MeSH terms