Comparative Study
. 2007 Sep 29;362(1485):1585-99.
doi: 10.1098/rstb.2007.2054.

Cortical mechanisms of action selection: the affordance competition hypothesis

Affiliations
Comparative Study

Cortical mechanisms of action selection: the affordance competition hypothesis

Paul Cisek. Philos Trans R Soc Lond B Biol Sci. .

Abstract

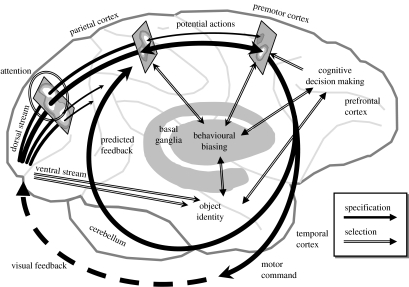
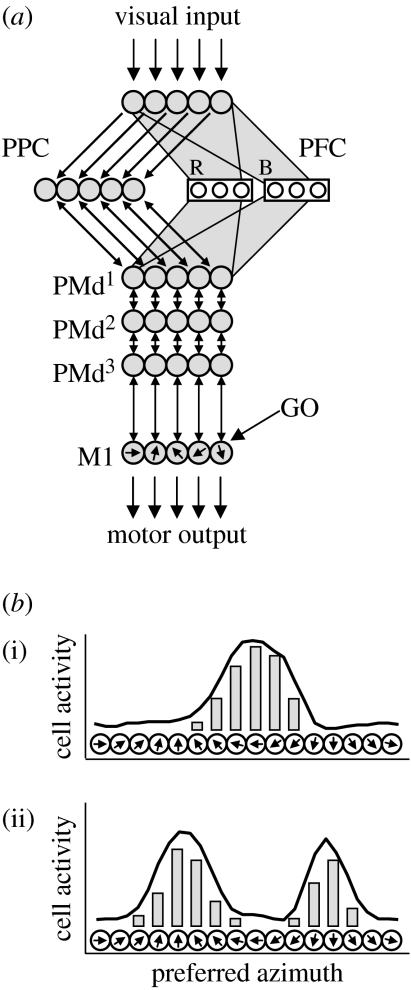
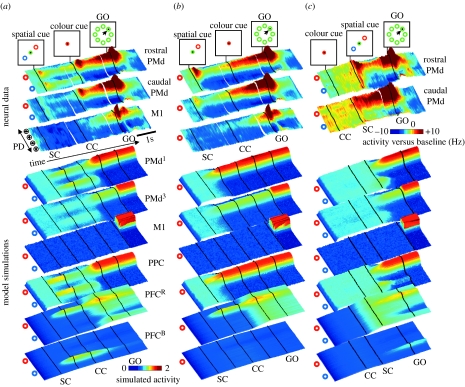
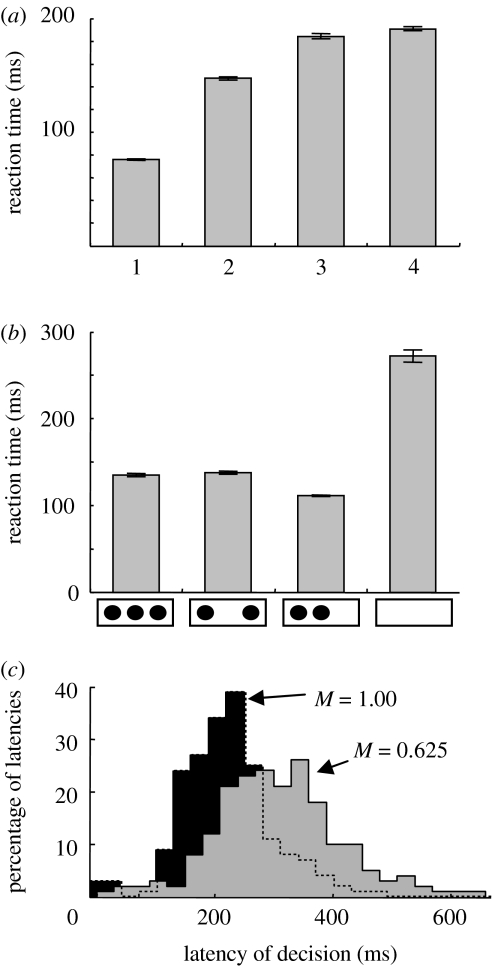
At every moment, the natural world presents animals with two fundamental pragmatic problems: selection between actions that are currently possible and specification of the parameters or metrics of those actions. It is commonly suggested that the brain addresses these by first constructing representations of the world on which to build knowledge and make a decision, and then by computing and executing an action plan. However, neurophysiological data argue against this serial viewpoint. In contrast, it is proposed here that the brain processes sensory information to specify, in parallel, several potential actions that are currently available. These potential actions compete against each other for further processing, while information is collected to bias this competition until a single response is selected. The hypothesis suggests that the dorsal visual system specifies actions which compete against each other within the fronto-parietal cortex, while a variety of biasing influences are provided by prefrontal regions and the basal ganglia. A computational model is described, which illustrates how this competition may take place in the cerebral cortex. Simulations of the model capture qualitative features of neurophysiological data and reproduce various behavioural phenomena.


Figures

Figure 1
Figure 1
Sketch of the proposed neural substrates of the affordance competition hypothesis, in the context of visually guided movement. The primate brain is shown, emphasizing the cerebral cortex, cerebellum and basal ganglia. Filled dark arrows represent processes of action specification, which begin in the visual cortex and proceed rightward across the parietal lobe, transforming visual information into representations of potential actions. Polygons represent three neural populations along this route: the leftmost represents the encoding of potential visual targets, modulated by attentional selection; the middle represents potential actions encoded in parietal cortex; and the rightmost represents activity in premotor regions. Each population is depicted as a map of neural activity, with activity peaks corresponding to the lightest regions. As the action specification occurs across the fronto-parietal cortex, distinct potential actions compete for further processing. This competition is biased by input from the basal ganglia and prefrontal cortical regions which collect information for action selection (double-line arrows). This biasing influences the competition in a number of loci, and owing to reciprocal connectivity, these influences are reflected over a large portion of the cerebral cortex. The final selected action is released into execution and causes both overt feedback through the environment (dashed black arrow) and internal predictive feedback through the cerebellum.
Figure 2
Figure 2
Computational model. (a) Each neural layer is depicted by a set of circles representing cells with different preferences for a movement parameter (e.g. direction). Thin arrows represent topographic connections (in most cases reciprocal) between layers involved in action specification. Grey polygons represent the input to and from prefrontal cortex, which is divided into two subpopulations each preferring a different stimulus colour. These projections are also topographic, but with much lower spatial resolution (see electronic supplemental material). Visual inputs are presented to the input layer, and the GO signal gates activity in primary motor cortex. Abbreviations: PPC, posterior parietal cortex; PFC, prefrontal cortex; PMd, dorsal premotor cortex; M1, primary motor cortex. (b) Each population consists of cells with different preferred directions, and their pattern of activity can represent (i) one potential reach direction or (ii) several potential directions simultaneously.
Figure 3
Figure 3
Comparison between neural activity and model simulations in three kinds of tasks. (a) Two-target task. During the spatial cue (SC), two possible targets are presented, one red and one blue. During the colour cue (CC), the centre indicates which of these is the correct target. The GO signal instructs the monkey to begin the movement. Neural data (Cisek & Kalaska 2005) are shown from three sets of neurons: rostral PMd, caudal PMd and primary motor cortex (M1). In each, neural activity is depicted as a three-dimensional coloured surface in which time runs from left to right and cells are sorted by their preferred direction along the left edge. Coloured circles indicate the locations of the two targets. Simulated model activities are depicted in the same format, where black lines indicate behavioural events (spatial cue on, spatial cue off, colour cue on, colour cue off, GO). (b) One-target task, same format as (a). (c) Matching task, same format as (a).
Figure 4
Figure 4
Latency effects. (a) Simulated reaction time during tasks with one, two, three or four targets presented for 1.3 s, followed by a single correct target for 0.1 s, followed by the GO signal. Reaction times were calculated as first time after the GO signal that any neuron in the M1 population exceeded an activity threshold of 1.5. The mean and standard error are shown for N=300 replications in each condition. (b) Simulated reaction time when cues are presented for 0.8 s followed by a single target for 0.3 s prior to the GO. The bars show mean±s.e. of reaction time in four conditions: when three cues are presented 80° apart, two cues 160° apart, two cues 80° apart or no cue at all. N=100 in each condition. (c) Distributions of decision latency computed during simulations (each with two targets) using a CC cue of different magnitudes. The decision latency was calculated as the time between the CC cue and the first time any PMd3 cell activity exceeded 0.75. N=200 for each condition.
Figure 5
Figure 5
Data and simulation of the timed response paradigms of Favilla (1997) and Ghez et al. (1997). (a) Behavioural data from the Ghez et al. (1997) task. Each panel shows the distribution of initial directions of force production with respect to two targets (vertical lines). Data are aligned such that the correct target (solid line) is on the right. Different distributions are reported for different delays between target identification and movement onset, and for different angular separations between the targets. (b) Simulations of the Ghez et al. (1997) task. Each panel shows the distribution of initial directions, calculated as the preferred direction of the first M1 cell whose activity exceeded a threshold of 1.75. (c) Behavioural data from Favilla (1997) task, in which four targets are shown either all 30° apart or grouped into two pairs that are far apart. Same format as (a). (d) Simulations of Favilla (1997) task, same format as (b). SR, time between selection and response.
Figure 6
Figure 6
Two possible conceptual taxonomies of neural processes. (a) The taxonomy implied by classical cognitive science, in which brain functions are classified as belonging to perceptual, cognitive or action systems. (b) An alternative taxonomy, in which brain functions are classified as processes aiding either action specification or action selection.

Similar articles

Cited by

References

    1. Adams F, Mele A. The role of intention in intentional action. Can. J. Philos. 1989;19:511–531.
    1. Alexander G.E, Crutcher M.D. Functional architecture of basal ganglia circuits: neural substrates of parallel processing. Trends Neurocogn. Sci. 1990a;13:266–271. doi:10.1016/0166-2236(90)90107-L - DOI - PubMed
    1. Alexander G.E, Crutcher M.D. Neural representations of the target (goal) of visually guided arm movements in three motor areas of the monkey. J. Neurophysiol. 1990b;64:164–178. - PubMed
    1. Alexander G.E, Crutcher M.D. Preparation for movement: neural representations of intended direction in three motor areas of the monkey. J. Neurophysiol. 1990c;64:133–150. - PubMed
    1. Allport D.A. Selection for action: some behavioral and neurophysiological considerations of attention and action. In: Heuer H, Sanders A.F, editors. Perspectives on perception and action. Lawrence Erlbaum Associates; Hillsdale, NJ: 1987. pp. 395–419.

Publication types

LinkOut - more resources