. 2007 Apr 17;104(16):6511-8.
doi: 10.1073/pnas.0700899104. Epub 2007 Apr 11.

Sterol-regulated transport of SREBPs from endoplasmic reticulum to Golgi: oxysterols block transport by binding to Insig

Affiliations

Sterol-regulated transport of SREBPs from endoplasmic reticulum to Golgi: oxysterols block transport by binding to Insig

Arun Radhakrishnan et al. Proc Natl Acad Sci U S A. .

Abstract

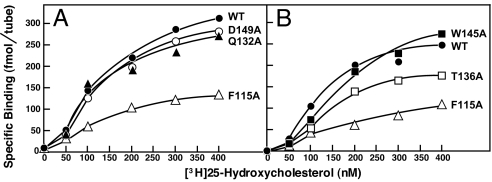
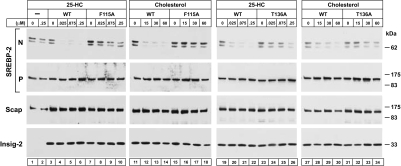
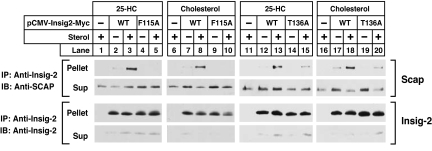
Cholesterol synthesis in animals is controlled by the regulated transport of sterol regulatory element-binding proteins (SREBPs) from the endoplasmic reticulum to the Golgi, where the transcription factors are processed proteolytically to release active fragments. Transport is inhibited by either cholesterol or oxysterols, blocking cholesterol synthesis. Cholesterol acts by binding to the SREBP-escort protein Scap, thereby causing Scap to bind to anchor proteins called Insigs. Here, we show that oxysterols act by binding to Insigs, causing Insigs to bind to Scap. Mutational analysis of the six transmembrane helices of Insigs reveals that the third and fourth are important for Insig's binding to oxysterols and to Scap. These studies define Insigs as oxysterol-binding proteins, explaining the long-known ability of oxysterols to inhibit cholesterol synthesis in animal cells.


Conflict of interest statement

The authors declare no conflict of interest.

Figures

Fig. 1.
Fig. 1.
Characterization of purified His10–Insig-2–FLAG. (A) Coomassie staining. Recombinant Insig-2 proteins were purified in two steps as described in Materials and Methods. Five micrograms of wild-type His10–Insig-2–FLAG or the indicated mutant version were subjected to 10% SDS/PAGE, and the proteins were visualized with Coomassie brilliant blue R-250 stain (Bio-Rad). Molecular masses of protein standards are indicated. (B) Gel filtration chromatography of purified proteins. Buffer A (100 μl) containing 6 nmol of either His10–Insig-2–FLAG or His10–Insig-2–FLAG(F115A) was loaded onto a Tricorn 10/300 Superose 6 column (Amersham) and chromatographed at a flow rate of 0.4 ml/min. Absorbance at 280 nm was monitored continuously to identify His10–Insig-2–FLAG (blue) or His10-Insig-2(F115A)-FLAG (red). Standard molecular mass markers (thyroglobulin, Mr 670,000; γ globulin, Mr 158,000; ovalbumin, Mr 44,000; myoglobin, Mr 17,000; and vitamin B12, Mr 1350) were chromatographed on the same column (arrows). The apparent molecular mass of His10–Insig-2–FLAG is 80 kDa. (C) Circular dichroism spectroscopy. Circular dichroism of 3 μM His10–Insig-2–FLAG or His10–Insig-2–FLAG(F115A) in buffer A was measured on an Aviv 62DS spectrometer using a 2-mm path length cuvette. The average of 10 spectra is shown.
Fig. 2.
Fig. 2.
Steroid specificity of binding to Insig-2 (A–C) and Scap(TM1–8) (D). (A and B) Total binding of [3H]steroids to Insig-2. Each assay tube, in a total volume of 100 μl of buffer A, contained 400 nM His10–Insig-2–FLAG (40 pmol), 25 mM phosphocholine chloride, and varying concentrations of the indicated [3H]steroid [[3H]25-HC (152 dpm/fmol) (A), [3H]cholesterol (120 dpm/fmol) (B), or [3H]progesterone (215 dpm/fmol) (B)] in the absence (filled symbols) or presence (open symbols) of the respective unlabeled steroid at a final concentration of 5 μM. After incubation for 4 h at room temperature, bound [3H]steroids were measured as described in Materials and Methods. Each data point is the average of duplicate assays and represents the total binding without subtraction of any blank values. (C) Specific binding of [3H]steroids to Insig-2. These data are replotted from A and B. (D) Specific binding of [3H]steroids to Scap(TM1–8). Each assay was carried out as described in A and B except that the tubes contained 120 nM His10–Scap(TM1–8) (12 pmol) instead of His10–Insig-2–Flag. Each data point is the average of duplicate assays. Specific binding in C and D was calculated by subtracting the binding value in the presence of unlabeled steroid from that in its absence.
Fig. 3.
Fig. 3.
Differential sterol specificity for Insig-2 and Scap: comparison of binding in vitro and inhibition of SREBP-2 cleavage in mammalian cells. (A) Chemical structure of cholesterol. (B) List of sterols tested and their actions in inhibiting SREBP-2 cleavage in intact cells and in competing with the binding of [3H]cholesterol to Scap and of [3H]25-HC to Insig-2. The degree of effect (maximal, intermediate, or minimal) is denoted by +, +/−, and −, respectively. For assays of SREBP-2 cleavage, 11 sterols (each at a final concentration of 20 μM in a 1:12 molar ratio with MCD) were tested in the current study (see C). The data for all other steroids have been reported (20, 27). Sterol 7 (sitosterol) could not be solubilized in a 1:12 molar ratio with MCD. For binding assays, all 22 sterols were tested in the current study; representative competition curves are shown in D and E. Trivial sterol names and their standard nomenclature (other than for cholesterol and its derivatives) are as follows: dihydrocholesterol for 5α-cholestan-3β-ol (2); desmosterol, 5,24-cholestadien-3β-ol (3); androstenol, 5-androsten-3β-ol (4); androstanol, 5α-androstan-3β-ol (5); sitosterol, 5-cholesten-24β-ethyl-3β-ol (7); 17-androstenediol, 5-androsten-3β,17β-diol (17); androstenolone, 5-androsten-3β-ol-17-one (18); epicholesterol, 5-cholesten-3α-ol (19); epi-androstanol, 5α-androstan-3α-ol (20); and lanosterol, 8,24,(5α)-cholestadien-4,4,14α-trimethyl-3β-ol (22). (C) Immunoblot analysis of SREBP-2 cleavage in mammalian cells. On day 2, CHO-K1 cells were incubated for 1 h in medium D containing 1% HPCD and then switched to medium D containing the indicated sterol (20 μM) complexed to MCD. After incubation for 6 h, cells were harvested, and total cell extracts were immunoblotted with IgG-7D4 (anti-SREBP-2). The precursor and mature nuclear form of SREBP-2 are denoted by P and N, respectively. (D) Competitive binding of [3H]cholesterol to Scap (Left) and [3H]25-HC to Insig-2 (Right). Each assay tube, in a total volume of 100 μl of buffer A, contained 25 mM phosphocholine chloride, 120 nM His10–Scap(TM1–8) or 400 nM His10–Insig-2–FLAG as indicated, 100 nM [3H]cholesterol (120 dpm/fmol) or 100 nM [3H]25-HC (152 dpm/fmol) as indicated, and varying concentration of the indicated unlabeled sterol. After incubation for 4 h at room temperature, bound [3H]cholesterol or [3H]25-HC was measured as described in Materials and Methods. Each data point is the average of duplicate assays and represents the amount of [3H]cholesterol or [3H]25-HC bound relative to that in the control tube, which contained no unlabeled sterol. In a typical competition experiment, six to nine unlabeled sterols were tested, two of which were always cholesterol and 25-HC. “100% of control” values for [3H]cholesterol binding (Left) ranged from 209 to 263 fmol per tube in four experiments. “100% of control” values for [3H]25-HC binding (Right) ranged from 199 to 261 fmol per tube in four experiments. All unlabeled sterols were tested in duplicate in two or more experiments with similar results.
Fig. 4.
Fig. 4.
Alanine scanning mutagenesis of human Insig-2 reveals five amino acid residues crucial for 25-HC mediated inhibition of SREBP-2 processing in insect cells. (A) Amino acid sequence and predicted topology of human Insig-2. The topology is based on that of Insig-1 (26). Amino acids in blue denote residues that, when mutated to alanine, did not interfere with 25-HC-mediated inhibition of SREBP-2 cleavage. Amino acids in red denote residues that when mutated to alanine created resistance to 25-HC mediated inhibition of SREBP-2 cleavage. (B) Immunoblot analysis of SREBP-2 cleavage. Drosophila S2 cells were transfected with the following plasmids per dish: 0.4 μg of pDS-HSV-SREBP-2, 0.05 μg of pAc-Scap, and 0.05 μg of either wild-type pAc–Insig-2–Myc or the indicated mutant. On day 2, the cells were switched to medium F containing the indicated concentration of 25-HC. After incubation for 6 h at 23°C, cells were harvested and whole cell lysates were subjected to SDS/PAGE and immunoblot analysis with anti-HSV-IgG (against SREBP-2), IgG-9D5 (against Scap), and IgG-9E10 (against Insig-2). P and I denote the uncleaved precursor and cleaved intermediate forms of SREBP-2, respectively.
Fig. 5.
Fig. 5.
[3H]25-HC binding to Insig-2 mutants. Each assay tube, in a total volume of 100 μl of buffer A, contained 400 nM His10–Insig-2–FLAG (wild-type or the indicated mutant version), 25 mM phosphocholine chloride, and the indicated concentration of [3H]25-HC (152 dpm/fmol). After incubation for 4 h at room temperature, specifically bound [3H]25-HC was measured as described in Fig. 2C. Each data point is the average of duplicate assays.
Fig. 6.
Fig. 6.
Failure of cholesterol and 25-HC to inhibit SREBP-2 processing in mammalian cells expressing Insig-2 mutants. On day 0, Scap-deficient SRD-13A cells were set up in medium C at 3.5 × 10⁵ cells per 60-mm dish. On day 2, each dish of cells was transfected in medium B with 2 μg of pTK-HSV-SREBP-2, 0.1 μg of pCMV-Scap, and one of the following pCMV–Insig-2–Myc plasmids: wild-type, 0.34 μg; F115A mutant, 0.64 μg; or T136A mutant, 0.34 μg. After incubation for 16 h at 37°C, the cells were switched to medium D containing 1% HPCD for 1 h, after which the cells were washed twice with PBS and switched to medium D containing the indicated amounts of cholesterol (complexed to MCD) or 25-HC (in ethanol). After incubation for 6 h at 37°C, the cells were harvested, fractionated, and subjected to SDS/PAGE and immunoblot analysis with anti-HSV-IgG (against SREBP-2), IgG-9D5 (against Scap), and IgG-9E10 (against Insig-2). N and P denote the cleaved nuclear and precursor forms of SREBP-2, respectively.
Fig. 7.
Fig. 7.
Mutant Insig-2s do not bind to Scap in presence of 25-HC or cholesterol. On day 0, Scap-deficient SRD-13A cells were set up in medium C at 3.5 × 10⁵ cells per 60-mm dish. On day 2, each dish of cells was transfected in medium B with 0.1 μg of pCMV-Scap and one of the following pCMV–Insig-2–Myc plasmids: wild-type, 0.16 μg; F115A mutant, 0.32 μg; or T136A mutant, 0.16 μg. After incubation for 6 h at 37°C, the cells were switched to medium D for 16 h, then switched to medium D containing 1% HPCD for 1 h, after which the cells were washed twice with PBS and switched to medium D containing no sterols, 0.075 μM 25-HC (in ethanol), or 30 μM cholesterol (complexed to MCD), as indicated. After incubation for 6 h at 37°C, cells were harvested, lysed, and immunoprecipitated with polyclonal anti-Myc to precipitate Insig-2. Pellets and supernatants (2.5:1 ratio) were subjected to SDS/PAGE and immunoblot analysis. Sup, supernatant fraction; IP, immunoprecipitate; IB, immunoblot.

Comment in

  • How sterols regulate protein sorting and traffic.
    Schekman R. Schekman R. Proc Natl Acad Sci U S A. 2007 Apr 17;104(16):6496-7. doi: 10.1073/pnas.0701774104. Epub 2007 Apr 11. Proc Natl Acad Sci U S A. 2007. PMID: 17428924 Free PMC article. No abstract available.

References

    1. Brown MS, Goldstein JL. Cell. 1997;89:331–340. - PubMed
    1. Edwards PA, Tabor D, Kast HR, Venkateswaran A. Biochim Biophys Acta. 2000;1529:103–113. - PubMed
    1. Goldstein JL, DeBose-Boyd RA, Brown MS. Cell. 2006;124:35–46. - PubMed
    1. Brown MS, Ye J, Rawson RB, Goldstein JL. Cell. 2000;100:391–398. - PubMed
    1. Matsuda M, Korn BS, Hammer RE, Moon Y.-A., Komuro R, Horton JD, Goldstein JL, Brown MS, Shimomura I. Genes Dev. 2001;15:1206–1216. - PMC - PubMed

Publication types

MeSH terms