Comparative Study
. 2007 Apr 11;27(15):4120-31.
doi: 10.1523/JNEUROSCI.4912-06.2007.

Early cross-modal interactions in auditory and visual cortex underlie a sound-induced visual illusion

Affiliations
Comparative Study

Early cross-modal interactions in auditory and visual cortex underlie a sound-induced visual illusion

Jyoti Mishra et al. J Neurosci. .

Abstract

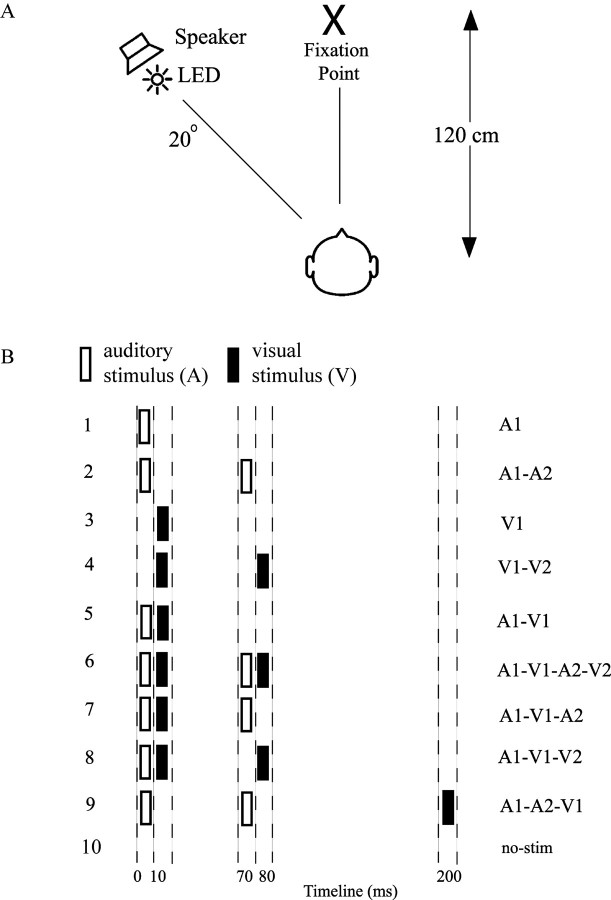
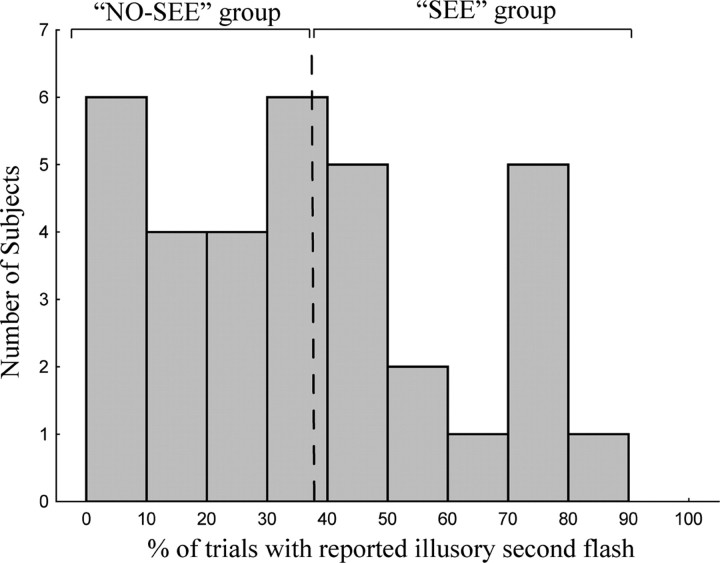
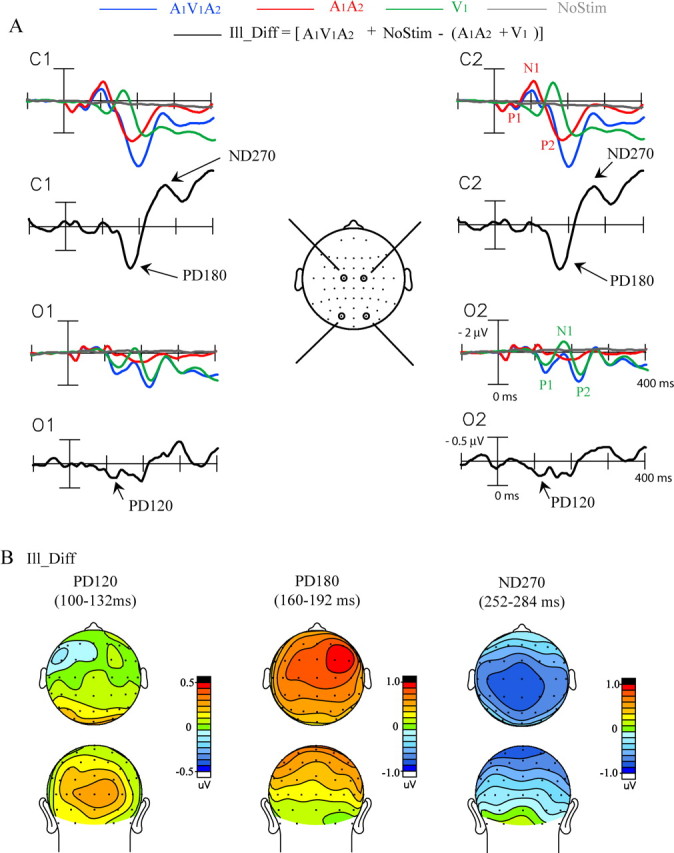
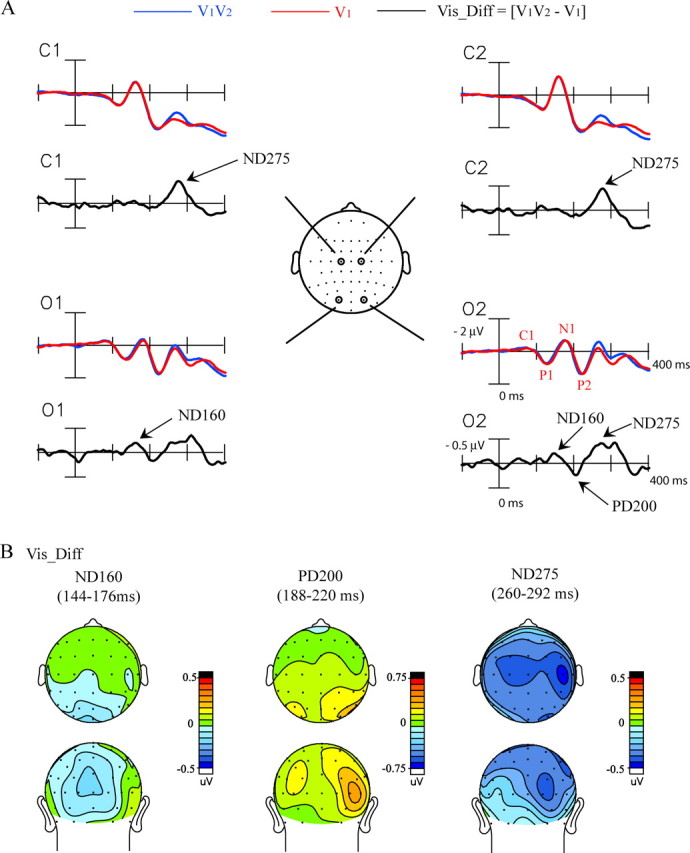
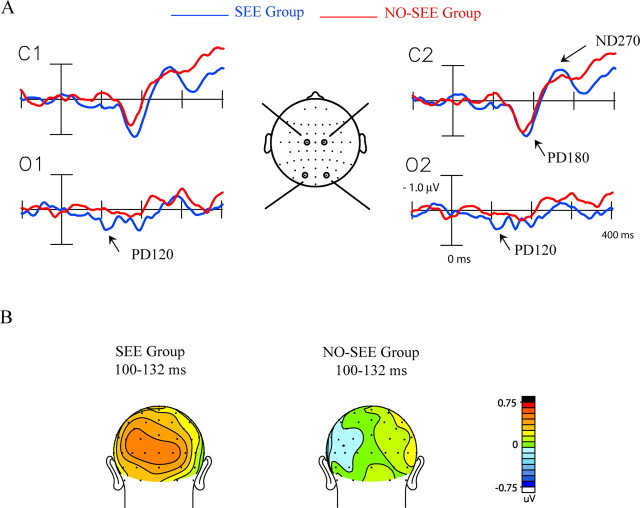
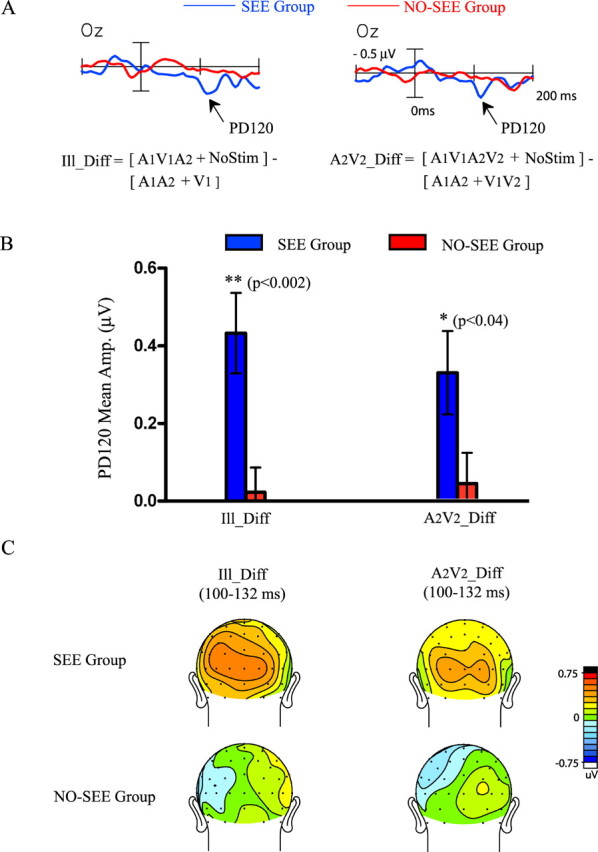
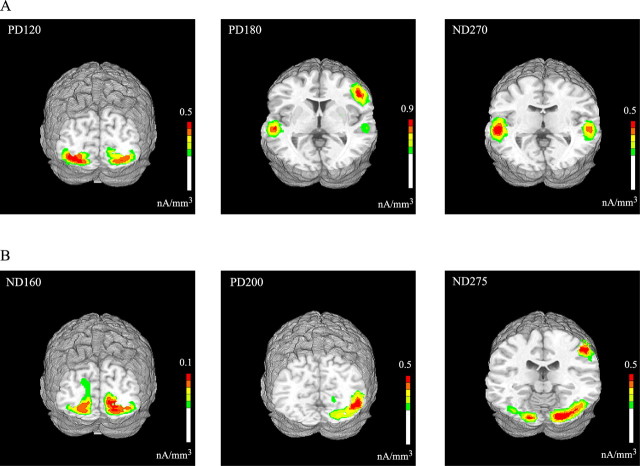
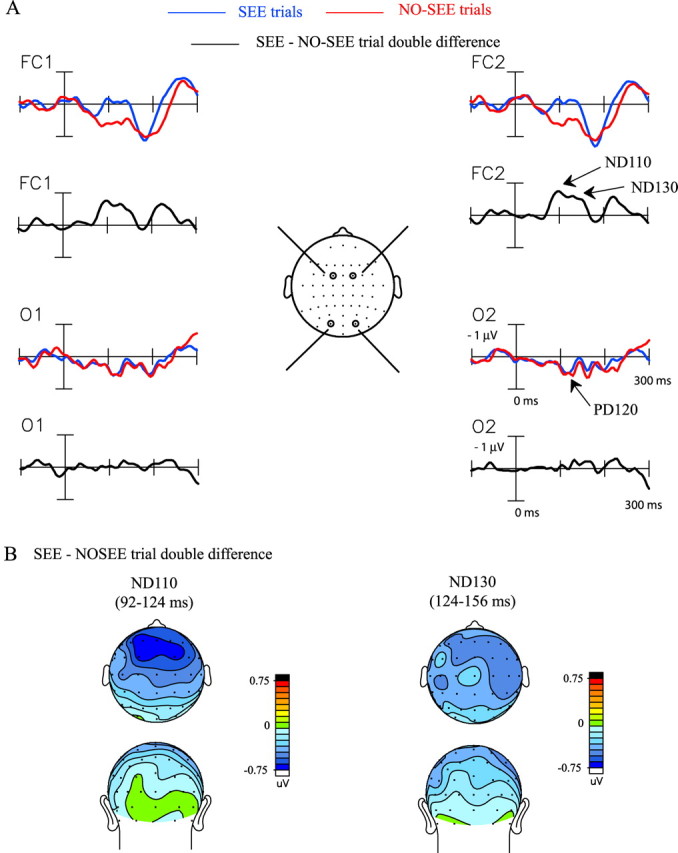
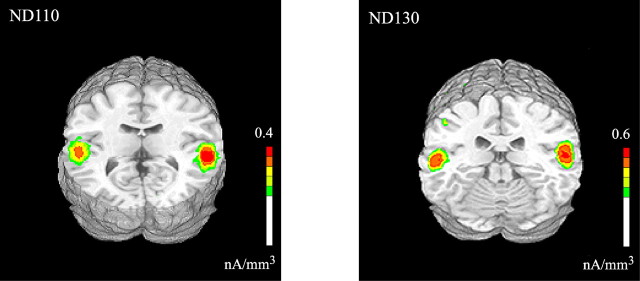
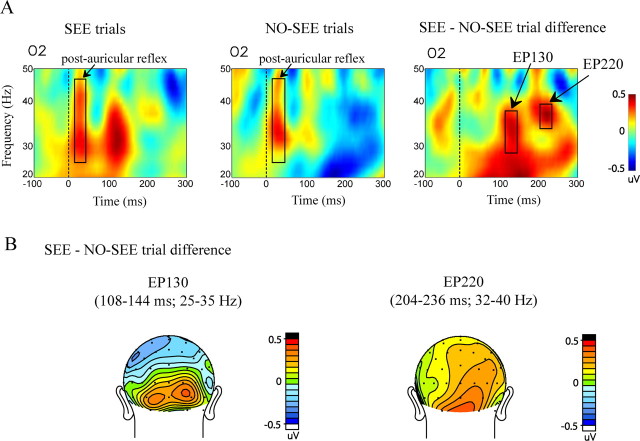
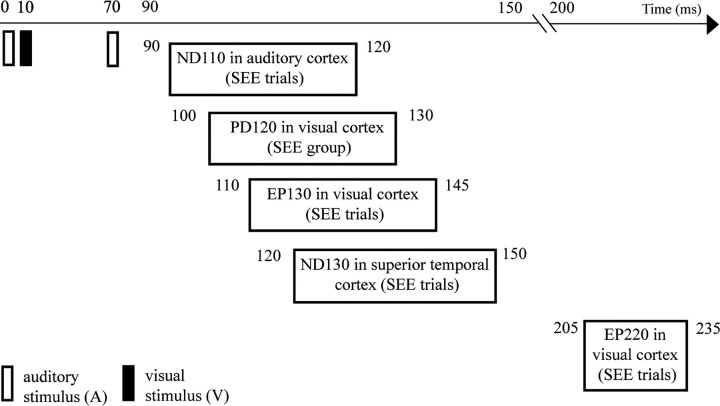
When a single flash of light is presented interposed between two brief auditory stimuli separated by 60-100 ms, subjects typically report perceiving two flashes (Shams et al., 2000, 2002). We investigated the timing and localization of the cortical processes that underlie this illusory flash effect in 34 subjects by means of 64-channel recordings of event-related potentials (ERPs). A difference ERP calculated to isolate neural activity associated with the illusory second flash revealed an early modulation of visual cortex activity at 30-60 ms after the second sound, which was larger in amplitude in subjects who saw the illusory flash more frequently. These subjects also showed this early modulation in response to other combinations of auditory and visual stimuli, thus pointing to consistent individual differences in the neural connectivity that underlies cross-modal integration. The overall pattern of cortical activity associated with the cross-modally induced illusory flash, however, differed markedly from that evoked by a real second flash. A trial-by-trial analysis showed that short-latency ERP activity localized to auditory cortex and polymodal cortex of the temporal lobe, concurrent with gamma bursts in visual cortex, were associated with perception of the double-flash illusion. These results provide evidence that perception of the illusory second flash is based on a very rapid dynamic interplay between auditory and visual cortical areas that is triggered by the second sound.


Figures

Figure 1.
Figure 1.
Overview of experimental design. A, Schematic diagram of experimental setup. B, Listing of the 10 different stimulus configurations, which were presented in random order. Abscissa indicates times of occurrence of auditory (open bars) and visual (solid bars) stimuli. Auditory (A) and visual (V) stimuli are labeled 1 or 2 to designate their first or second occurrence in each configuration. LED, Light-emitting diode.
Figure 2.
Figure 2.
Histogram of number of subjects who reported seeing the illusory second flash to the A1V1A2 stimulus on different percentages of trials. Subjects were divided by a median split into those who saw the illusion more frequently (SEE group) and less frequently (NO-SEE group).
Figure 3.
Figure 3.
Grand-averaged ERPs (n = 34) associated with the sound-induced illusory flash. A, ERPs elicited by the illusion-inducing A1V1A2 stimulus and by its unimodal constituents A1A2 and V1, together with the ERP time locked to the blank no-stim event. The Ill_Diff difference wave (see Materials and Methods) reflects the cross-modal interactions giving rise to the illusory second flash. Recordings are from left and right central (C1, C2) and occipital (O1, O2) sites. B, Topographical voltage maps of the three major components in the Ill_Diff difference wave shown in top and back views.
Figure 4.
Figure 4.
Grand-averaged ERPs (n = 34) associated with the veridical second flash. A, ERPs elicited by the pair of flashes, V1V2, and by the single flash, V1. The Vis_Diff difference wave reflects neural activity elicited by the second flash, V2. Recordings are from left and right central (C1, C2) and occipital (O1, O2) sites. B, Topographical voltage maps of the three major components in the Vis_Diff difference wave shown in top and back views.
Figure 5.
Figure 5.
ERP differences between the SEE and NO-SEE groups. A, Ill_Diff difference waves averaged separately for the SEE group (n = 17) and the NO-SEE group (n = 17). Recordings are from left and right central (C1, C2) and occipital (O1, O2) sites. B, Voltage maps in back view comparing the topography of the PD120 component in the Ill_Diff difference waves in the two groups.
Figure 6.
Figure 6.
Comparison of the PD120 component elicited in the Ill_Diff and A2V2_Diff cross-modal difference waves for the SEE and NO-SEE groups. A, Waveforms of the Ill_Diff and A2V2_Diff difference waves for the two groups recorded from an occipital electrode (Oz). B, Bar graphs comparing the mean amplitude of PD120 in the interval 100–132 ms in the Ill_Diff and A2V2_Diff waveforms for the two groups. C, Voltage maps comparing PD120 topographies for the two groups.
Figure 7.
Figure 7.
Estimated sources for the major components in the grand-averaged Ill_Diff (A) and Vis_Diff (B) waveforms modeled using LAURA. Results are shown on a standard fMRI rendered brain in Talairach space. LAURA inverse solutions are represented in units of current source density (nanoamperes per cubic millimeter).
Figure 8.
Figure 8.
ERP differences between SEE and NO-SEE trials within the SEE subject group. A, Ill_Diff difference waves within the SEE group averaged separately for SEE and NO-SEE trials. The SEE–NO-SEE trial double-difference wave reflects differential neural activity elicited on the SEE trials with respect to NO-SEE trials. Recordings are from left and right frontocentral (FC1, FC2) and occipital (O1, O2) sites. B, Topographical voltage map of the two major components, ND110 and ND130, in the SEE–NO-SEE trial double-difference wave shown in top and back views.
Figure 9.
Figure 9.
Estimated sources for the two early components in the SEE–NO-SEE trial double-difference wave modeled in the SEE group using LAURA. Results are shown on a standard fMRI rendered brain in Talairach space. LAURA inverse solutions are represented in units of current source density (nanoamperes per cubic millimeter).
Figure 10.
Figure 10.
Frequency domain activity associated with perception of the sound induced illusory flash in the SEE subject group. A, Time–frequency representation of the total average spectral amplitude on SEE trials, NO-SEE trials, and the SEE–NO-SEE trial difference from an occipital electrode (O2). B, Spatial topography maps of the two time–frequency blocks of differential spectral amplitude, EP130 and EP220, found in the SEE–NO-SEE trial difference shown in back view.
Figure 11.
Figure 11.
Summary of temporal progression of early cortical activity found to be associated with the sound induced extra flash illusion.

References

    1. Andersen TS, Tiippana K, Sams M. Factors influencing audiovisual fission and fusion illusions. Brain Res Cogn Brain Res. 2004;21:301–308. - PubMed
    1. Arden GB, Wolf JE, Messiter C. Electrical activity in visual cortex associated with combined auditory and visual stimulation in temporal sequences known to be associated with a visual illusion. Vision Res. 2003;43:2469–2478. - PubMed
    1. Baier B, Kleinschmidt A, Muller NG. Cross-modal processing in early visual and auditory cortices depends on expected statistical relationship of multisensory information. J Neurosci. 2006;26:12260–12265. - PMC - PubMed
    1. Bavelier D, Neville HJ. Cross-modal plasticity: where and how? Nat Rev Neurosci. 2002;3:443–452. - PubMed
    1. Bhattacharya J, Shams L, Shimojo S. Sound-induced illusory flash perception: role of gamma band responses. NeuroReport. 2002;13:1727–1730. - PubMed

Publication types

LinkOut - more resources