Review
. 2007 Apr;87(2):593-658.
doi: 10.1152/physrev.00035.2006.

Inositol trisphosphate receptor Ca2+ release channels

Affiliations
Review

Inositol trisphosphate receptor Ca2+ release channels

J Kevin Foskett et al. Physiol Rev. 2007 Apr.

Abstract

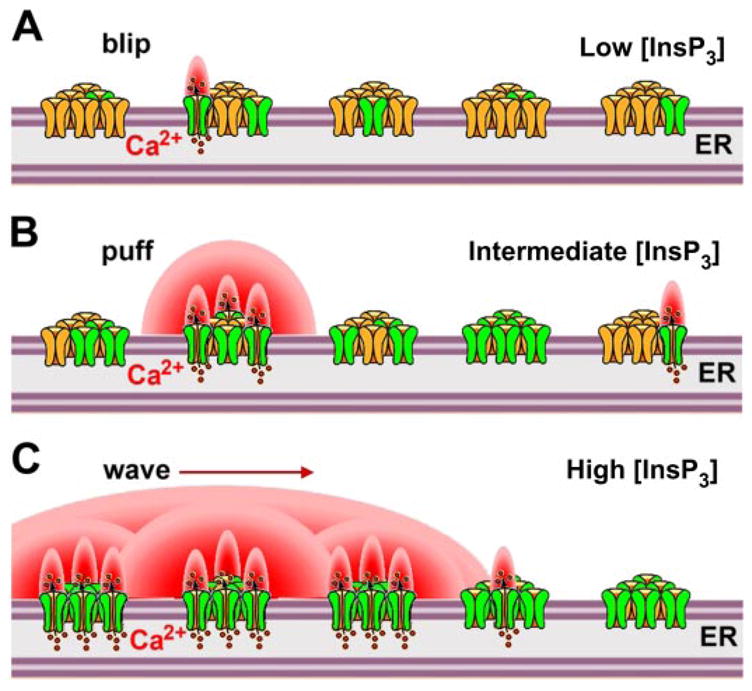
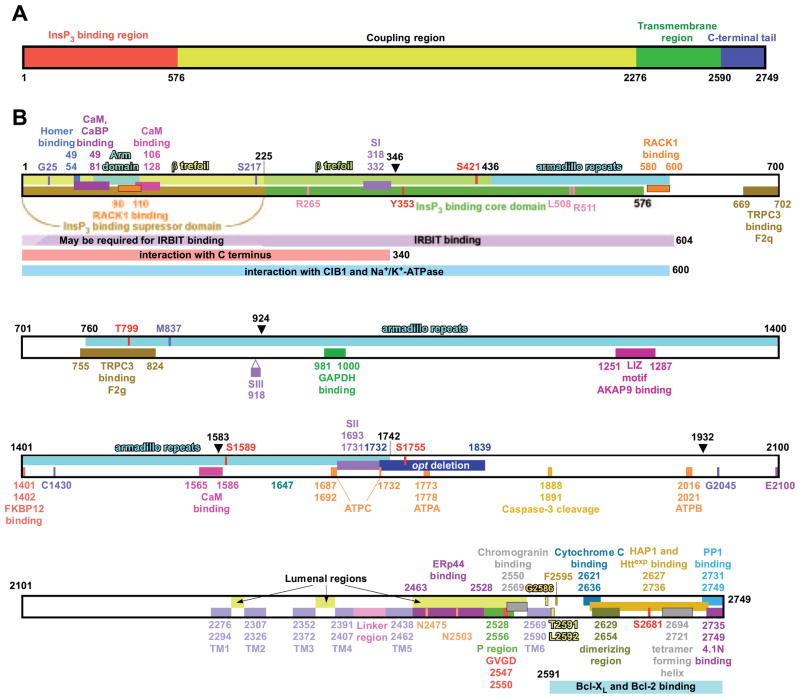
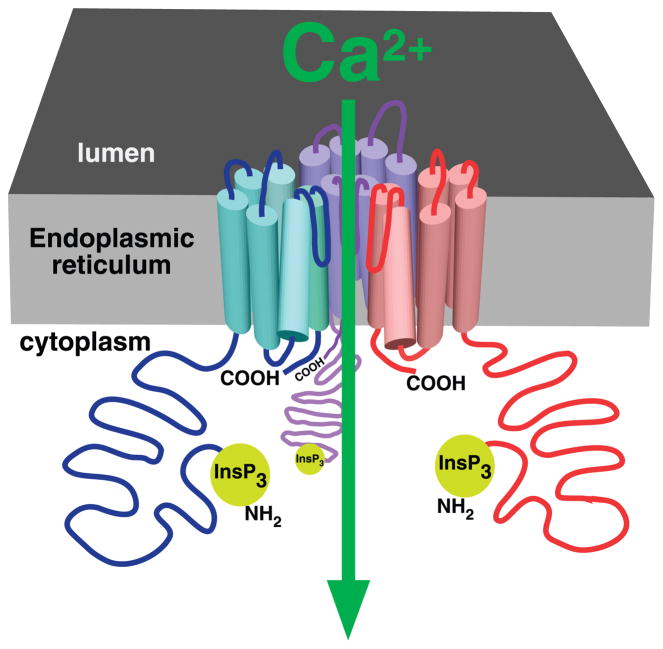
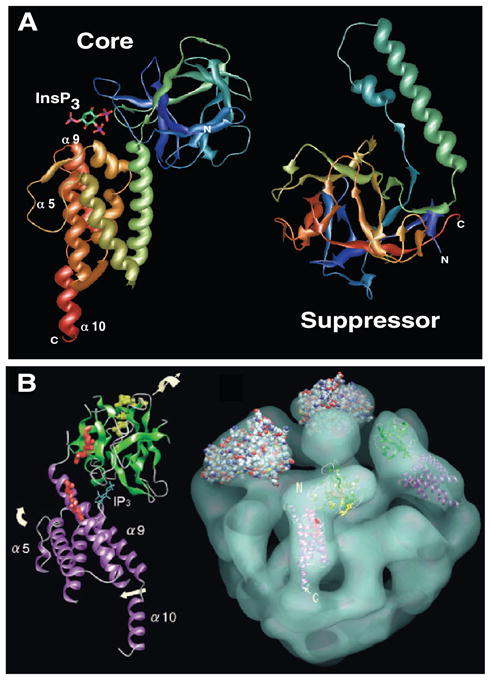
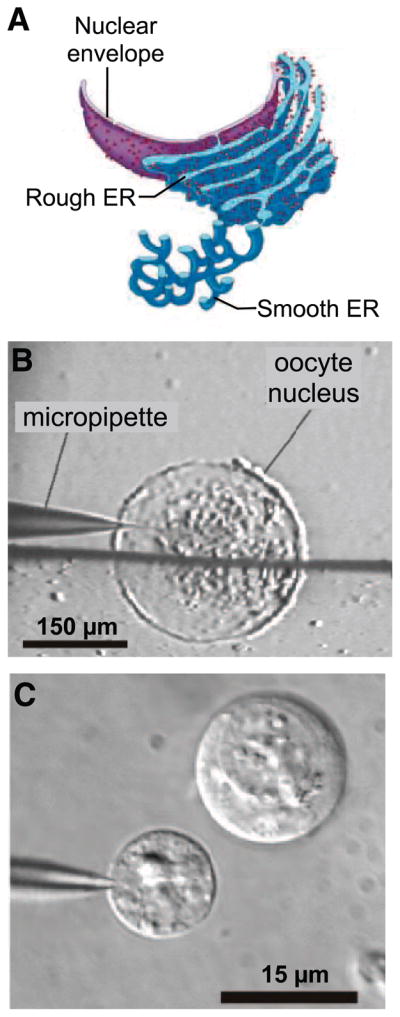
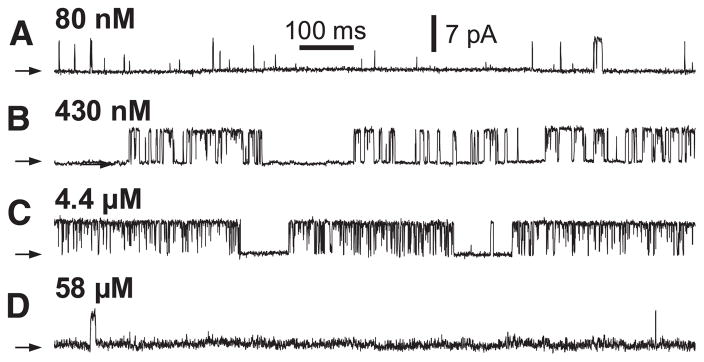
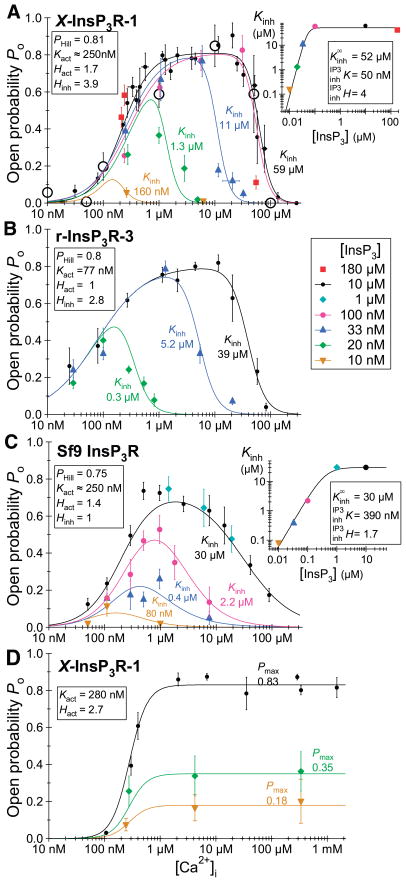
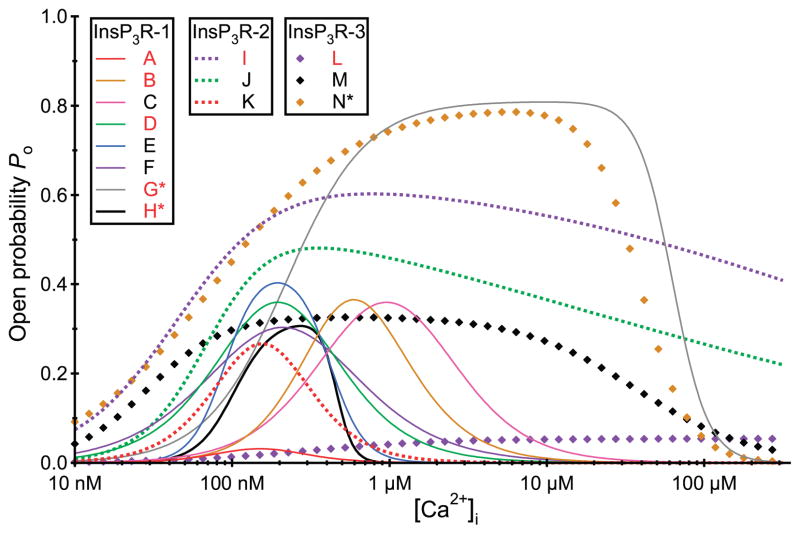
The inositol 1,4,5-trisphosphate (InsP3) receptors (InsP3Rs) are a family of Ca2+ release channels localized predominately in the endoplasmic reticulum of all cell types. They function to release Ca2+ into the cytoplasm in response to InsP3 produced by diverse stimuli, generating complex local and global Ca2+ signals that regulate numerous cell physiological processes ranging from gene transcription to secretion to learning and memory. The InsP3R is a calcium-selective cation channel whose gating is regulated not only by InsP3, but by other ligands as well, in particular cytoplasmic Ca2+. Over the last decade, detailed quantitative studies of InsP3R channel function and its regulation by ligands and interacting proteins have provided new insights into a remarkable richness of channel regulation and of the structural aspects that underlie signal transduction and permeation. Here, we focus on these developments and review and synthesize the literature regarding the structure and single-channel properties of the InsP3R.


Figures

FIG. 1
FIG. 1
Schematic of the behaviors of inositol trisphosphate receptor (InsP3R) channels in the presence of increasing concentrations of InsP3. InsP3Rs are shown arranged in clusters that form discrete release sites within the continuous endoplasmic reticulum. A: at low [InsP3] during weak agonist stimulation, few receptors (in green) bind InsP3. Others (in yellow) are not InsP3 liganded and therefore not activated. Consequently, highly localized small Ca2+ signals (“blips”) are generated by Ca2+ released through a single or few InsP3R channels raising cytoplasmic Ca2+ concentration (shown in red). B: at higher levels of [InsP3], coordinated openings of several channels (InsP3 liganded) within a cluster is triggered by Ca2+ release from one channel acting as an activating ligand to stimulate gating of nearby channels through a process of Ca2+-induced Ca2+ release (CICR). C: even higher [InsP3] evokes global propagating Ca2+ signals (waves). Ca2+ released at one cluster can trigger Ca2+ release at adjacent clusters by CICR, leading to the generation of Ca2+ waves that propagate by successive cycles of Ca2+ release, diffusion, and CICR. [Figure kindly supplied by I. Parker and N. Callamaras. Adapted from Parker et al. (358).]
FIG. 2
FIG. 2
Structural determinants of the InsP3R. A: overall domain structure. The InsP3R molecule depicted as a linear amino acid sequence, with the NH2-terminal InsP3 binding region (red), coupling region (yellow), transmembrane region (green), and COOH tail (blue) depicted. B: linear amino acid sequence. Residues are numbered according to the rat type 1 SI+, SII+, SIII− sequence (protein accession no. 121838). Structural features (see section in this review where each element is described) shown are as follows: arm subdomain and β-trefoil in the InsP3-binding suppressor domain (sect. IIIB1); β-trefoil and armadillo repeats in InsP3 binding core domain (sect. IIIB1); armadillo repeats in the coupling domain (sect. IIIB3); alternative splicing regions SI, SII, and SIII (sect. IIB2) for type 1 InsP3R; opt deletion in type 1 InsP3R mutant (sect. IIIB3); ATP-binding sites ATPA, ATPB, and ATPC (sect. VIF4); transmembrane helices TM1–6 and pore-forming P region (sect. IIIB2A) with selectivity filter (sect. VF); linker region (sect. IIIB1); dimerizing region (sect. IIIC1); tetramer forming region (sect. IIIC1). Trypsin proteolysis sites (sect. IIIC3) are indicated by black arrowheads. The caspase 3 cleavage site (sect. IIIC3) is also shown. G25 (sect. IIIB1), S217 (sect. IIIB1), T799 (sect. IIIB3), M837 (sect. IIIB3), C1430 (sect. IIIB3), and G2045 (sect. IIIB3) are highly conserved residues the mutation of which can impact InsP3R channel functions. Mutation of E2100 modifies Ca2+ regulation of InsP3R channel (sect. VIK). R265, L508, and R511 are critically important for InsP3 binding (sect. IIIB1). G2586, T2591, L2592, and F2595 are residues that may be involved in forming the gate of the InsP3R channel (sect. IIIB2B). N2475 and N2503 are glycosylation sites (sect. IIIB). S1589 and S1755 are PKA/PKG phosphorylation sites (sect. VIL, 1 and 2); S2681 is an Akt phosphorylation site (sect. VIL4); Y353 is a Fyn tyrosine kinase phosphorylation site (sect. VIL5); and S421 and T799 are cdc2/CyB phosphorylation sites (sect. VIL6). Sequences involved in interaction of InsP3R channel with the following proteins are also depicted: homer (sect. VIN13); calmodulin (sect. VIN1); CaBP (sect. VIN2); RACK1 (sect. VIN3); IRBIT (sect. VIN4); CIB1 (sect. VIN2); Na+-K+-ATPase (sect. VIN14); COOH terminal of InsP3R in the tetrameric channel (sect. IIIB1); TRPC3 (sect. VIN14); GAPDH (sect. VIN8); AKAP9 [through leucine/isoleucine zipper (LIZ) motif] (sect. VIL1); FKBP12 (sect. VIN7); Erp44 (sect. VIN6); chromogranins (sect. VIN5); cytochrome c (sect. VIN10); HAP1 and Httexp (sect. VIN11); protein 4.1N (sect. VIN13); and PP1 (sect. VIL1).
FIG. 3
FIG. 3
The InsP3R Ca2+ release channel. Cartoon depicting three of four InsP3R molecules (in different colors) in a single tetrameric channel structure. Part of the luminal loop connecting transmembrane helices 5 and 6 of each monomer dips into the fourfold symmetrical axis, creating the permeation pathway for Ca2+ efflux from the lumen of the endoplasmic reticulum.
FIG. 4
FIG. 4
Structures of the InsP3R. A: crystal structures of the core InsP3 binding domain (left) and suppressor domain (right). InsP3 present in the core domain structure coordinated in a cleft created by an NH2-terminal β-sheet-rich β-trefoil domain and an α-helical armadillo-repeat domain. Suppressor domain is comprised entirely of a β-trefoil domain (head) with a helical insert (arm). Structures solved in Refs. , . B: cryoelectron microscopic single-particle reconstruction of InsP3R (right, tilted with respect to the plane of the page with cytoplasmic aspect facing upwards toward viewer with InsP3 binding core domain density fitted into an L-shaped density). For a better fit, various parts of the InsP3 binding core domain were rotated as indicated by the arrows with respect to the crystal structure shown in A. N and C refer to NH2 and COOH termini of each domain in A and B. [From Sato et al. (407), with permission from Elsevier.]
FIG. 5
FIG. 5
Nuclear patch-clamp electrophysiology. A: schematic of cell nucleus, illustrating that the outer membrane of the double-membrane nuclear envelope is continuous with the endoplasmic reticulum (ER), with the lumen between the two membranes continuous with the ER lumen. Patch-clamping isolated Xenopus oocyte nucleus (B) and insect Sf9 cell nucleus (C) visualized on the stage of a patch-clamp microscope, with patch pipettes forming giga-ohm seals on the outer nuclear membrane. Horizontal shadow over the Xenopus nucleus is the edge of a stabilizing piece of coverslip. Intact Sf9 cell is also present in C. [B modified from Mak et al. (287).]
FIG. 6
FIG. 6
Typical single-channel current traces of X-InsP3R-1 in various cytoplasmic Ca2+ concentrations and saturating 10 μM InsP3. Current traces were recorded during nuclear patch-clamp experiments at cytoplasmic Ca2+ concentrations as tabulated, in 0.5 mM free ATP. All current traces in this and other graphs were recorded at 20 mV. Arrows indicate closed-channel current level in all current traces. Channel open probability (Po) was evaluated for the single-channel patch-clamp experiments yielding the current traces shown in A, B, C, and D of 0.008, 0.50, 0.89, and 0.002, respectively. [Modified from Mak et al. (282).]
FIG. 7
FIG. 7
[Ca2+]i and [InsP3] regulation of InsP3R channel activity. A: [Ca2+]i dependence of mean Po of endogenous X-InsP3R-1 channels (solid symbols) in various [InsP3] as tabulated. [Modified from Mak et al. (282).] Each data point in this and subsequent Po versus [Ca2+ ]i plots is the average of channel Po from at least 4 experiments using the same ligand concentrations. The curves are least-squares fit of the data points using the biphasic Ca2+ regulation Hill equation (Eq. 1) with parameters as tabulated. The large open circles represent Po for recombinant rat InsP3R-1 channels in various [Ca2+]i in saturating 10 μM InsP3. [Modified from Boehning et al. (42).] Inset: plot of Kinh derived from the biphasic Hill equation fit of Po data versus [InsP3] used. The curve is the least-squares fit of the Kinh values using the activation Hill equation Kinh=Kinh{1+(KinhIP3/[InsP3])HinhIP3}1 with parameters as tabulated. B: [Ca2+]i dependence of mean Po of recombinant r-InsP3R-3 channels in various [InsP3] as tabulated. [Modified from Mak et al. (283).] Data points and fitted curves are obtained as described for A. C: [Ca2+]i dependence of mean Po of endogenous InsP3R channels from Sf9 cells in various [InsP3] as tabulated. [Modified from Ionescu et al. (196).] Data points, fitted curves, and inset graph are obtained as described for A. D: [Ca2+]i dependence of mean Po of X-InsP3R-1 InsP3R channels that have been exposed to bath solution with very low [Ca2+]i (< 5 nM) for a few minutes before the patch-clamp experiments, in various [InsP3] as tabulated. The curves are least-squares fits to the data using activation Hill equation Po = PHill{1 + (Kact/[Ca2+]i)Hact}−1 with parameters as tabulated. [Modified from Mak et al. (286).]
FIG. 8
FIG. 8
[Ca2+]i dependence of vertebrate InsP3R channel activity in saturating [InsP3] observed in various single-channel studies. Biphasic Hill equation curves shown are generated either using parameters provided by studies cited below, or by fitting data provided in those studies with the Hill equation. Entries denoted by red letters are data from endogenously expressed InsP3R channels; other entries denoted by black letters are from recombinant homotetrameric InsP3R channels. Entries marked with asterisks are obtained by nuclear patch-clamp experiments; others are from InsP3R channels reconstituted into planar lipid bilayers. All data were observed in the presence of 0.5–1 mM Na2 ATP on the cytoplasmic side of the channel unless stated otherwise. A: canine cerebellar (438). B: bovine cerebellar in 0 ATP (382). C: rat type 1 SI+ SII+ in COS cells in 0 ATP (381). D: rat cerebellar (478). E: rat type 1 SI− SII+ in Sf9 cells (478). F: rat type 1 SI− SII+ in Sf9 cells (479). G: Xenopus oocyte (282). H: rat cerebellar (294). I: ferret cardiac ventricular myocyte in 0 ATP (382). J: rat type 2 in COS cells in 0 ATP (380). K: rat type 2 in Sf9 cells (481). L: rat pancreatic RIN-m5F cells (163). M: rat type 3 in Sf9 cells in 5 mM Na2ATP (481). N: rat type 3 in Xenopus oocytes (283).
FIG. 9
FIG. 9
Biphasic Hill equation fits to InsP3R channel Po versus [Ca2+]i data. Open squares are experimental data, and smooth curves are Hill equation fit to the data using parameters as tabulated. A: channel Po data for recombinant rat type 1 E2100D mutant InsP3R expressed in Sf9 cells were fitted (black curve) using modified biphasic Hill equation (Eq. 2) with parameters given in Ref. , tabulated in black. An alternative Hill equation fit (thick yellow curve) using the same equation with a different set of parameters (tabulated in yellow) is effectively indistinguishable from the fit provided in Ref. . B: channel Po data for recombinant wild-type Drosophila InsP3R channel expressed in Sf9 cells were fitted (black curve) using modified biphasic Hill equation (Eq. 2) with parameters given in Ref. , tabulated in black. The more general Hill equation (Eq. 1) gives a better fit to the data (red curve) using parameters tabulated in red.
FIG. 10
FIG. 10
Regulation of InsP3R channel activity by ATP. A: [Ca2+]i dependence of mean Po of endogenous X-InsP3R-1 channels in the presence of various [ATP]free as tabulated. [Modified from Mak et al. (281).] Solid symbols represent data obtained in the absence of Mg2+. Open circles represent data obtained in 3 mM Mg2+ and 0 ATP. Open squares represent data obtained in 3 mM Mg2+ and 0.5 mM total [ATP], with [ATP]free = 12 μM calculated by MaxChelator. The curves are fits using either the biphasic Hill equation (Eq. 1) to the data in [ATP]free = 0 (blue) or 0.5 mM (black); or the activating Hill equation (see legend for Fig. 7) to the data in other [ATP]free (10 nM < [Ca2+]i < 1 μM). Biphasic Hill equation parameters fitting data in 0 [ATP]free (blue curve) are tabulated. Inset: plot of the Hill equation parameter Kact versus [ATP]free used. The curve is a fit to the Kact values using the modified Michaelis-Menten equation Kact=Kact0ATP+(KactATPKact0ATP){1+([ATP]free/KactATP)}1 with parameters as tabulated. B: [Ca2+]i dependence of mean Po of recombinant r-InsP3R-3 channels in the presence of various [ATP]free as tabulated. [Modified from Mak et al. (280).] Solid symbols, open circles, and open squares represent data in a similar convention as described for A. Solid curves are either biphasic Hill equation fit or activation Hill equation fit to the data in various [ATP]free as described for A. The thick dashed blue curve is the biphasic Hill equation fit to channel Po for X-InsP3R-1 in the absence of ATP plotted for comparison. Parameters are tabulated for biphasic Hill equation fit to r-InsP3R-3 channel Po in 0 ATP (in blue), as well as those for activating Hill equation fit to r-InsP3R-3 channel Po in [ATP]free = 0.3 mM (in yellow) and 0.5 mM (in black) ([Ca2+]i < 1 μM). C: [Ca2+]i dependence of mean Po of endogenous X-InsP3R-1 channels in 0 ATP in the presence of various [InsP3] as tabulated. The curves are fits to the data using biphasic Hill equation (Eq. 1) with parameters as tabulated. [Modified from Mak et al. (279).] D: channel Po versus [ATP]free curves calculated for X-InsP3R-1 channels in 10 μM InsP3 and various [Ca2+]i as labeled, using the biphasic Hill equation (Eq. 1) and the modified Michaelis-Menten equation in A.
FIG. 11
FIG. 11
Typical single-channel current traces of X-InsP3R-1 in various [Mg2+] and [ATP]free. A: current trace was recorded at optimal (6.2 μM) [Ca2+]i and saturating (10 μM) [InsP3] in the absence of ATP and Mg2+.[Modified from Mak et al. (279).] The remaining current traces were recorded at 0.25 μM [Ca2+]i and saturating [InsP3] (10 μM). [Modified from Mak et al. (281).] B: [ATP]free = 0.5 mM, [Mg2+] = 0 mM. C: [ATP]free = 0 mM, [Mg2+] = 0 mM. D: [ATP]free = 0 mM, [Mg2+] = 3 mM. E: total [ATP] = 0.5 mM, [Mg2+] = 3 mM, [ATP]free = 12 μM calculated by MaxChelator software (29). F: total [ATP] = 4.8 mM, [Mg2+] = 3 mM, [ATP]free = 1.9 mM calculated by MaxChelator. Arrows indicate closed-channel current level in the traces. Channel Po evaluated for the single-channel patch-clamp experiments yielding the current traces shown in AF are 0.79, 0.46, 0.10, 0.10, 0.10, and 0.76, respectively.
FIG. 12
FIG. 12
InsP3R channel activities activated by adenophostin A (AdA). [Ca2+]i dependence of mean Po of endogenous X-InsP3R-1 channels in the presence of various ligand (AdA or InsP3) concentrations as tabulated in 0.5 mM [ATP]free (A) or 0 [ATP]free (B). The curves are biphasic Hill equation (Eq. 2) fit to the data using parameters as tabulated. Typical single-channel current traces of X-InsP3R-1 in outer nuclear membrane recorded at optimal [Ca2+]i and saturating 100 nM AdA in 0.5 mM [ATP]free with channel Po of 0.72 (C) and 0 [ATP]free with channel Po of 0.39 (D). [Modified from Mak et al. (279).]
FIG. 13
FIG. 13
Dependencies on [Ca2+]i and [InsP3] of InsP3R channel activity duration and recruitment. A: channel activity duration. Data points are averages of channel activity durations in ligand conditions as tabulated. Smooth curves in graphs in this figure were drawn by hand for clarity. B: ligand-dependent recruitment of InsP3R. Data points are average number of active channels in membrane patches (NA) in ligand concentrations as tabulated. C: ligand-dependent relative magnitude of InsP3R-mediated Ca2+ release. The product NAPo, determined using data shown in Fig. 6B and Fig. 1D, in ligand concentrations as tabulated. [Modified from Ionescu et al. (196).]

References

    1. Abe H, Shuto S, Matsuda A. Synthesis of the C-glycosidic analog of adenophostin A and its uracil congener as potential IP3 receptor ligands. Stereoselective construction of the C-glycosidic structure by a temporary silicon-tethered radical coupling reaction. J Org Chem. 2000;65:4315–4325. - PubMed
    1. Abraham RT, Wiederrecht GJ. Immunopharmacology of rapamycin. Annu Rev Immunol. 1996;14:483–510. - PubMed
    1. Acharya JK, Jalink K, Hardy RW, Hartenstein V, Zuker CS. InsP3 receptor is essential for growth and differentiation but not for vision in Drosophila. Neuron. 1997;18:881–887. - PubMed
    1. Adkins CE, Morris SA, De Smedt H, Sienaert I, Torok K, Taylor CW. Ca2+-calmodulin inhibits Ca2+ release mediated by type-1, -2 and -3 inositol trisphosphate receptors. Biochem J. 2000;345:357–363. - PMC - PubMed
    1. Adkins CE, Wissing F, Potter BV, Taylor CW. Rapid activation and partial inactivation of inositol trisphosphate receptors by adenophostin A. Biochem J. 2000;352:929–933. - PMC - PubMed

Publication types

LinkOut - more resources