. 2007 May;24(5):1364-72.
doi: 10.1364/josaa.24.001364.

Photoreceptor counting and montaging of en-face retinal images from an adaptive optics fundus camera

Affiliations

Photoreceptor counting and montaging of en-face retinal images from an adaptive optics fundus camera

Bai Xue et al. J Opt Soc Am A Opt Image Sci Vis. 2007 May.

Abstract

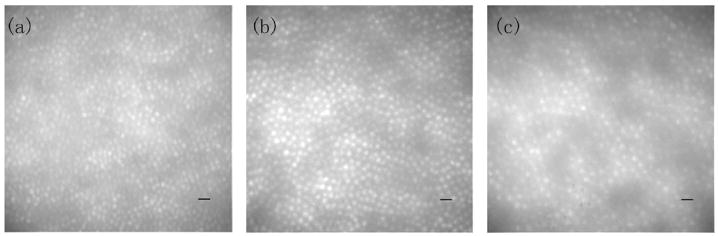
A fast and efficient method for quantifying photoreceptor density in images obtained with an en-face flood-illuminated adaptive optics (AO) imaging system is described. To improve accuracy of cone counting, en-face images are analyzed over extended areas. This is achieved with two separate semiautomated algorithms: (1) a montaging algorithm that joins retinal images with overlapping common features without edge effects and (2) a cone density measurement algorithm that counts the individual cones in the montaged image. The accuracy of the cone density measurement algorithm is high, with >97% agreement for a simulated retinal image (of known density, with low contrast) and for AO images from normal eyes when compared with previously reported histological data. Our algorithms do not require spatial regularity in cone packing and are, therefore, useful for counting cones in diseased retinas, as demonstrated for eyes with Stargardt's macular dystrophy and retinitis pigmentosa.


Figures

Fig. 1
Fig. 1
AO retinal images using a 550 nm imaging wavelength at three locations from one normal subject, N1: (a) 2° temporal retina, (b) 4° temporal retina, (c) 7° nasal retina. Scale bar corresponds to 10 μm.
Fig. 2
Fig. 2
(Color online) Cone density measurement on a simulated cone mosaic image. (a) Artificial cone mosaic image (peak intensity of each cone, 0.5–1). (b) Image (a) after adding background and Gaussian filtering (contrast=0.37). (c) PSF of a typical subject (Strehl ratio=0.018; RMS=2.3 μm; 650 nm wavelength; 7 mm pupil) before AO correction. (d) Image (b) after PSF filtering and addition of simulated noise (contrast=0.18). (e) Calculated cone mosaic by the connected component labeling algorithm. (f) Cone density measurement for image (d).
Fig. 3
Fig. 3
(Color online) Flowchart of semiautomated cone density measurement procedure. (a) Cropped AO retinal image from subject N1 at 4° temporal retina (imaging wavelength=550 nm). (b) Image (a) after Gaussian filtering. (c) Image after background subtraction and linear scaling. (d) Cone counting result in the first intensity section 246–255. (e) Cone counting result in the second intensity section 236–245. (f) Cone counting result in the last intensity section 16–25. (g) Outcome of cone counting (all the cones are accurately identified with cone density of 25,164 cells/mm2).
Fig. 4
Fig. 4
(Color online) Retinal image montage and corresponding cone density measurement for the subject ST1. (a) Montage of four retinal images taken at 650 nm. (b) Cone density map of montaged image in (a) (cone density=5247 cells/mm2). Scale bar corresponds to 10 μm on the retina.
Fig. 5
Fig. 5
(Color online) Retinal images and cone density maps for two normal subjects, N2 and N3. (a) Cropped retinal image and cone density measurement for N2 at 2° temporal retina (cone density=42,389 cells/mm2). (b) Cropped retinal image and cone density measurement for N3 at 4° temporal 4° superior retina (cone density=20,151 cells/mm2). Images were taken with a 650 nm imaging wavelength. Scale bar corresponds to 10 μm on the retina.
Fig. 6
Fig. 6
(Color online) AO retinal images at two locations and the corresponding cone density calculations for subject RP1. (a) AO retinal image and cone density map at 2° temporal 4° superior retina (cone density=4779 cells/mm2). (b) AO retinal image and cone density map at 4° temporal 4° inferior retina (cone density=4012 cells/mm2). Images were taken at a 650 nm imaging wavelength. Scale bar corresponds to 10 μm on the retina.

References

    1. Liang J, Williams DR, Miller DT. Supernormal vision and high-resolution retinal imaging through adaptive optics. J Opt Soc Am A. 1997;11:2884–2892. - PubMed
    1. Zhang Y, Poonja S, Roorda A. MEMS-based adaptive optics scanning laser ophthalmoscopy. Opt Lett. 2006;31:1268–1270. - PubMed
    1. Roorda A, Romero-Borja F, Donnelly WJ, III, Queener H, Hebert TJ, Campbell MCW. Adaptive optics scanning laser ophthalmoscopy. Opt Express. 2002;10:405–412. - PubMed
    1. Hammer DX, Ferguson RD, Bigelow CE, Iftimia NV, Ustun TE, Burns SA. Adaptive optics scanning laser ophthalmoscope for stabilized retinal imaging. Opt Express. 2006;14:3354–3367. - PMC - PubMed
    1. Hermann B, Fernandez EJ, Unterhubner A, Sattmann H, Fercher AF, Drexler W, Prieto PM, Artal P. Adaptive-optics ultrahigh-resolution optical coherence tomography. Opt Lett. 2004;29:2142–2144. - PubMed

Publication types

LinkOut - more resources