. 2007 May;24(5):1373-83.
doi: 10.1364/josaa.24.001373.

Adaptive optics-optical coherence tomography: optimizing visualization of microscopic retinal structures in three dimensions

Affiliations

Adaptive optics-optical coherence tomography: optimizing visualization of microscopic retinal structures in three dimensions

Robert J Zawadzki et al. J Opt Soc Am A Opt Image Sci Vis. 2007 May.

Abstract

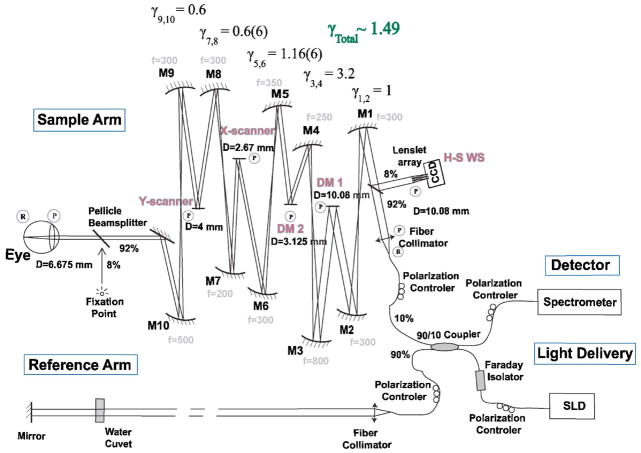
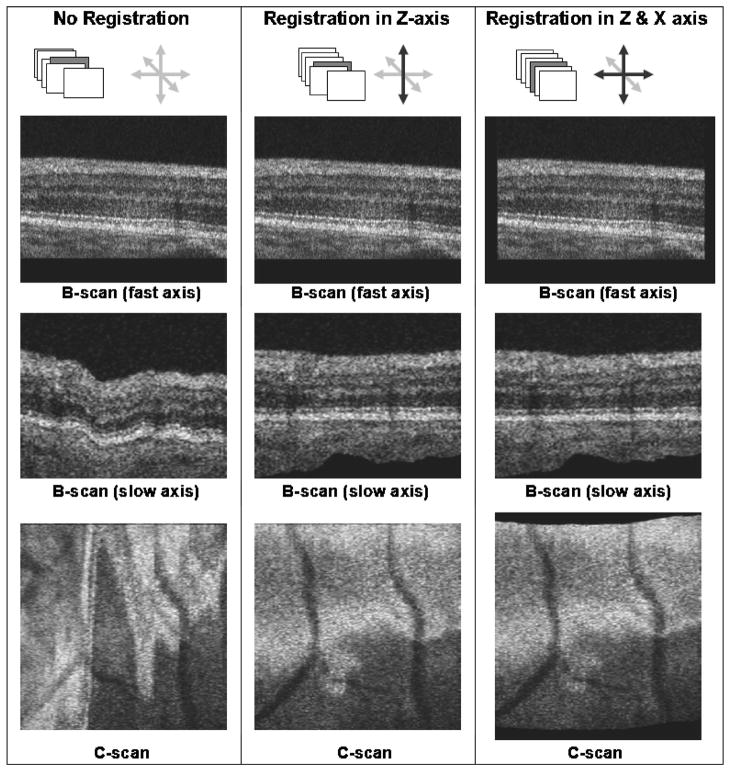
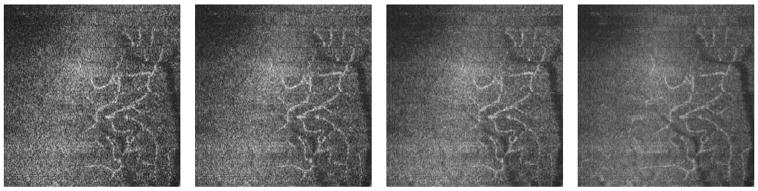
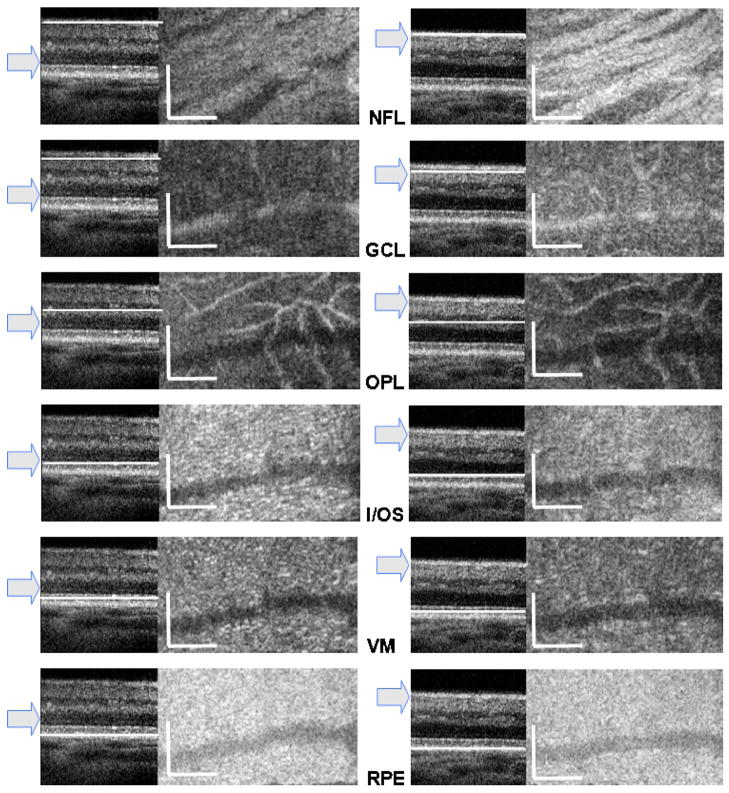
Adaptive optics-optical coherence tomography (AO-OCT) permits improved imaging of microscopic retinal structures by combining the high lateral resolution of AO with the high axial resolution of OCT, resulting in the narrowest three-dimensional (3D) point-spread function (PSF) of all in vivo retinal imaging techniques. Owing to the high volumetric resolution of AO-OCT systems, it is now possible, for the first time, to acquire images of 3D cellular structures in the living retina. Thus, with AO-OCT, those retinal structures that are not visible with AO or OCT alone (e.g., bundles of retinal nerve fiber layers, 3D mosaic of photoreceptors, 3D structure of microvasculature, and detailed structure of retinal disruptions) can be visualized. Our current AO-OCT instrumentation uses spectrometer-based Fourier-domain OCT technology and two-deformable-mirror-based AO wavefront correction. We describe image processing methods that help to remove motion artifacts observed in volumetric data, followed by innovative data visualization techniques [including two-dimensional (2D) and 3D representations]. Finally, examples of microscopic retinal structures that are acquired with the University of California Davis AO-OCT system are presented.


Figures

Fig. 1
Fig. 1
(Color online) Schematic of AO-OCT system. “R” and “P” denote retinal and pupil planes, respectively. DM1, bimorph deformable mirror (AOptix); DM2, MEMS DM (Boston Micromachines) are optically conjugated [by sets of the spherical-mirror—(Mn)-based telescopes] with the subject’s eye pupil, XY scanners and the H-S wavefront sensor. The reference arm of the AO-OCT system is designed to match the path length of the sample arm. A fixation point is used to set the retinal location of the imaged structure.
Fig. 2
Fig. 2
(Color online) (Top) Example traces of the wavefront RMS in micrometers; (bottom) PSF Strehl ratio reconstructed from H-S centroid displacements (measured on a healthy volunteer’s eye) plotted as a function of time for two-DM AO system operation.
Fig. 3
Fig. 3
(Color online) AO-OCT B-scans and corresponding averaged frame intensity profiles of the healthy retina acquired at 5° temporal retina. These frames have been picked arbitrarily from a movie acquired during the starting sequence of our AO system (an example is presented in Fig. 2). (Top) B-scan before correction, (middle) B-scan with DM1 correction only, (bottom) B-scan with DM1 on hold and DM2 active. Note increased intensity of photoreceptor layers and decrease in the depth of focus for improved wavefront error correction. Scale bar on the B-scans is 100 μm.
Fig. 4
Fig. 4
Orientation of fast- and slow-axis scans used for AO-OCT volume acquisition, and location of the cutting planes used in presentation of the volumetric data.
Fig. 5
Fig. 5
Examples of the B-scan self-registration algorithm performance presented on original B-scans (top), on reconstructed slow-axis B-scans (middle), and C-scans (bottom). Registered and unregistered axes are denoted by black and gray arrows, respectively.
Fig. 6
Fig. 6
Screen shot from IDAV volume renderer for visualizing retinal data. Small images on the left provide access to three independent planes that can be moved through the volume by a cursor; large image on the right shows the reconstructed volume.
Fig. 7
Fig. 7
C-scan of microvasculature reconstructed from retinal volume (1 m × 1 m) with intensity calculated by axial averaging. Each image illustrates averaging of different numbers of C-scans (0, 4, 16, or 64 frames). The foveolar center is located at the upper left corner.
Fig. 8
Fig. 8
(Color online) C-scan visualization of retinal capillaries and foveal avascular zone (1.5° nasal, 1.5° inferior retina). Square in fundus photo shows estimated location of the retinal volume in the panel below. The three figures on the right each show identical B-scans with a white line to illustrate the position of the corresponding C-scan.
Fig. 9
Fig. 9
(Color online) Reconstructed slow-axis B-scans and C-scans from two retinal volumes acquired with the focus set on photoreceptor layers (left column) and on upper retinal layers (right column). Arrow in each panel denotes estimated focus position. Rows show C-scan reconstruction of the same retinal layer (denoted by abbreviations) with the exact position indicated by a white line on the B-scan. Retinal layers in C-scans from top to bottom are nerve fiber layer (NFL), ganglion cell layer (GCL), outer plexiform layer (OPL), inner/outer segment junction (I/OS), Verhoeff’s membrane (VM), and retinal pigmented epithelium (RPE). Scale bars = 100 μm (vertical and horizontal).
Fig. 10
Fig. 10
Visualization of a microscopic druse in a patient with age-related macular degeneration. Details of the volume renderer as in Fig. 6.

References

    1. Fercher AF, Hitzenberger CK, Kamp G, Elzaiat Y. Measurement of intraocular distances by backscattering spectral interferometry. Opt Commun. 1995;117:43–48.
    1. Häusler G, Lindner MW. Coherence radar and spectral radar—new tools for dermatological diagnosis. J Biomed Opt. 1998;7:21–31. - PubMed
    1. Wojtkowski M, Leitgeb R, Kowalczyk A, Bajraszewski T, Fercher AF. In vivo human retinal imaging by Fourier domain optical coherence tomography. J Biomed Opt. 2002;7:457–463. - PubMed
    1. Wojtkowski M, Bajraszewski T, Targowski P, Kowalczyk A. Real time in vivo imaging by high-speed spectral optical coherence tomography. Opt Lett. 2003;28:1745–1747. - PubMed
    1. Nassif NA, Cense B, Park BH, Pierce MC, Yun SH, Bouma BE, Tearney GJ, Chen TC, de Boer JF. In vivo high-resolution video-rate spectral-domain optical coherence tomography of the human retina and optic nerve. Opt Express. 2004;12:367–376. - PubMed

Publication types

MeSH terms