. 2007 May;24(5):1438-47.
doi: 10.1364/josaa.24.001438.

Adaptive optics retinal imaging reveals S-cone dystrophy in tritan color-vision deficiency

Affiliations

Adaptive optics retinal imaging reveals S-cone dystrophy in tritan color-vision deficiency

Rigmor C Baraas et al. J Opt Soc Am A Opt Image Sci Vis. 2007 May.

Abstract

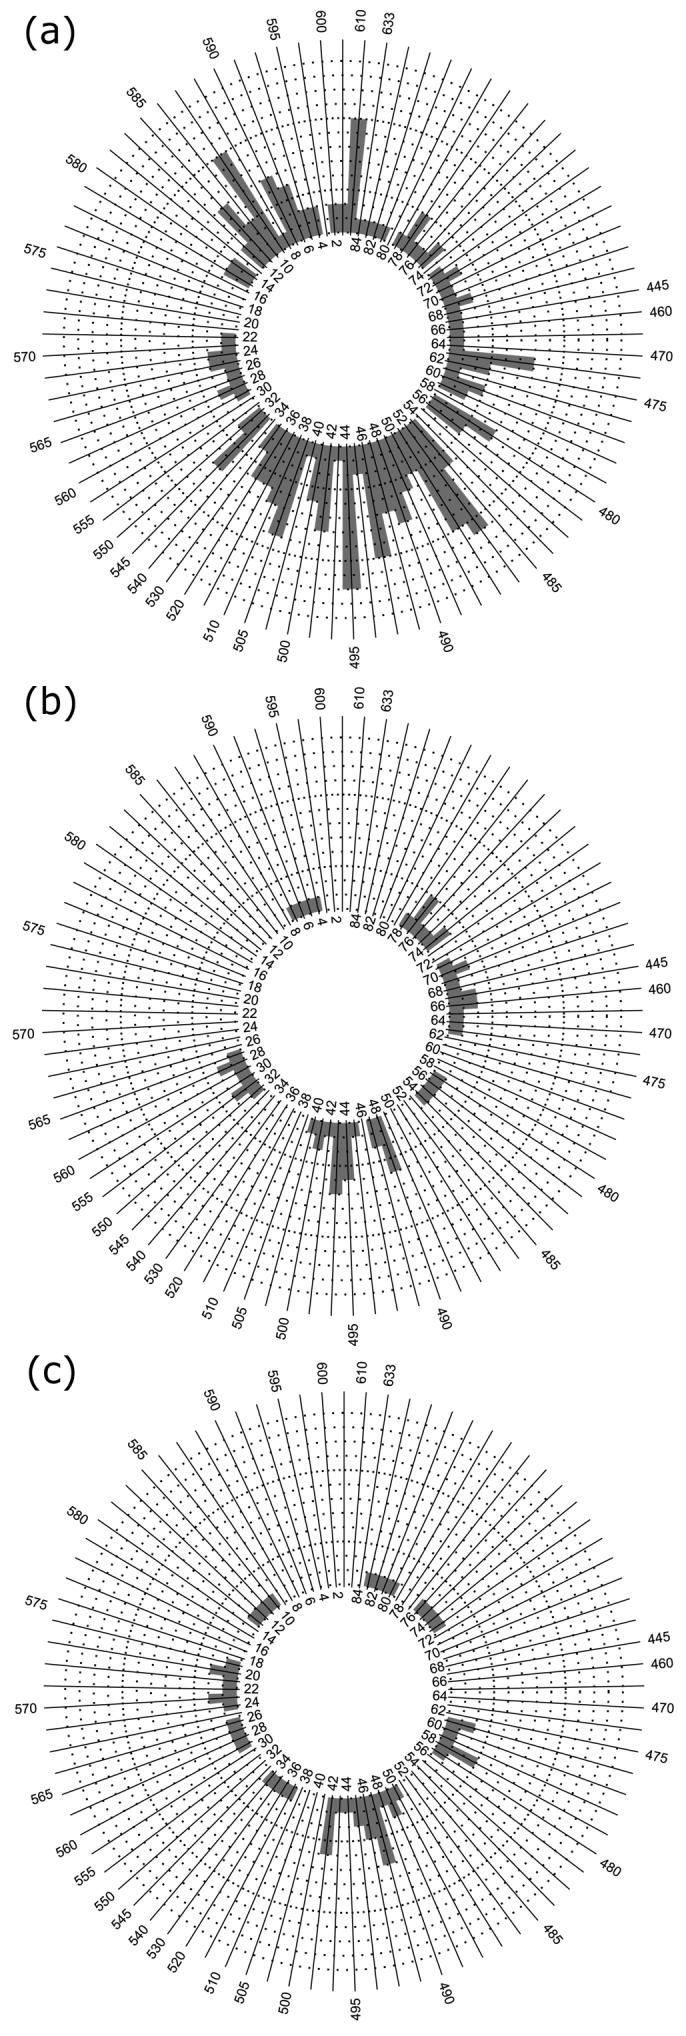
Tritan color-vision deficiency is an autosomal dominant disorder associated with mutations in the short-wavelength-sensitive- (S-) cone-pigment gene. An unexplained feature of the disorder is that individuals with the same mutation manifest different degrees of deficiency. To date, it has not been possible to examine whether any loss of S-cone function is accompanied by physical disruption in the cone mosaic. Two related tritan subjects with the same novel mutation in their S-cone-opsin gene, but different degrees of deficiency, were examined. Adaptive optics was used to obtain high-resolution retinal images, which revealed distinctly different S-cone mosaics consistent with their discrepant phenotypes. In addition, a significant disruption in the regularity of the overall cone mosaic was observed in the subject completely lacking S-cone function. These results taken together with other recent findings from molecular genetics indicate that, with rare exceptions, tritan deficiency is progressive in nature.


Figures

Fig. 1
Fig. 1
Results of the Farnsworth-Munsell 100-Hue test for subjects (a) M04 (father), (b) M505 (daughter), (c) M503 (son).
Fig. 2
Fig. 2
Model of the S-opsin gene. Circles represent amino acids. The light gray circle indicates the location of the R283Q substitution in the family in this study, who had differing degrees of tritan color-vision deficiency. The other four reported mutations causing tritan color-vision deficiency are indicated by black filled circles: G79R, S214P, P264S, L56P. The figure is modified from Ref. with permission.
Fig. 3
Fig. 3
Retinal images of two tritan subjects. (a) Images from the right eye of the daughter (M505). Numerous cones that are either S cones or empty cones are visible as dark regions in the absorptance image. Given M505's behavioral measurements, and the fact that the number of candidate S cones is consistent with normal S-cone density, it is probable that they are S cones. The analysis was done at two different retinal locations at 1.25-deg eccentricity. (b) Images from left eye of the father (M04) at 1.25-deg eccentricity. There is no evidence for S cones. There appears to be some increased irregularity in the mosaic, which may be a signature of cone death.
Fig. 4
Fig. 4
Analysis of mosaic regularity. (a) Retinal image from a normal trichromat (R008, 1.0 deg). (b) Two-dimensional plot of cone locations from (a). (c) Voronoi domain associated with each cone photoreceptor in (a). (d) Color-coded version of (c), where the color indicates the number of sides on each Voronoi polygon (magenta=4, blue=5, green=6, yellow=7, red=8, purple=9). Large regions of six-sided polygons indicate a regular triangular lattice, whereas other colors mark points of disruptions in the hexagonal packing of the foveal mosaic. (e) Color-coded Voronoi diagram from a normal trichromat (R031, 1.25 deg). (f) Color-coded Voronoi diagram from a tritanopic subject (M04, 1.0 deg). The normal subjects were chosen for comparison because they had cone densities close to that of M04.
Fig.5
Fig.5
Correlation of cone density with (a) SD of Voronoi area and (b) mean NND. Filled circles are from normal controls, open squares are from subject M04 (1.0 and 1.25 deg). Solid line is best-fitting linear regression, and dashed lines are 95% confidence intervals.

References

    1. Wright WD. The characteristics of tritanopia. Journal of the Optical Society of America. 1952;42:509–521. - PubMed
    1. Piantanida T. Genetics of inherited colour vision deficiencies. In: Foster DH, editor. Inherited and Acquired Colour Vision Deficiencies: Fundamental Aspects and Clinical Studies. Houndmills, Basingstoke: Macmillan Press; 1991. pp. 88–114.
    1. Cole BL, Henry GH, Nathan J. Phenotypical variations of tritanopia. Vision Research. 1966;6:301–313.
    1. Kalmus H. The familial distribution of congenital tritanopia, with some remarks on some similar conditions. Annals of Human Genetics. 1955;20:39–56. - PubMed
    1. Miyake Y, Yagasaki K, Ichikawa H. Differential diagnosis of congenital tritanopia and dominantly inherited juvenile optic atrophy. Archives Ophthalmology. 1985;103:1496–1501. - PubMed

Publication types