. 2007 Apr 12:7:30.
doi: 10.1186/1471-2180-7-30.

Assessing the reliability of eBURST using simulated populations with known ancestry

Affiliations

Assessing the reliability of eBURST using simulated populations with known ancestry

Katherine M E Turner et al. BMC Microbiol. .

Abstract

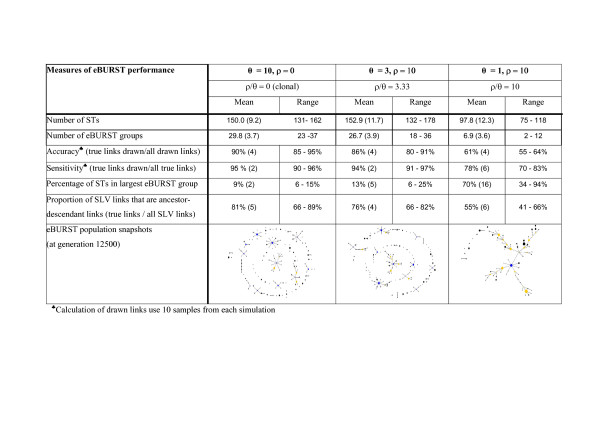
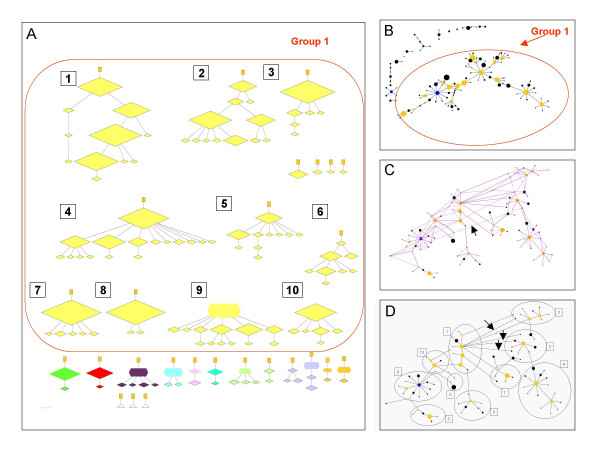
Background: The program eBURST uses multilocus sequence typing data to divide bacterial populations into groups of closely related strains (clonal complexes), predicts the founding genotype of each group, and displays the patterns of recent evolutionary descent of all other strains in the group from the founder. The reliability of eBURST was evaluated using populations simulated with different levels of recombination in which the ancestry of all strains was known.

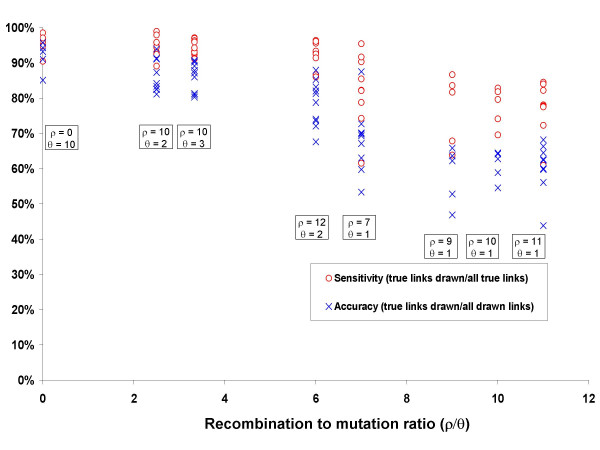
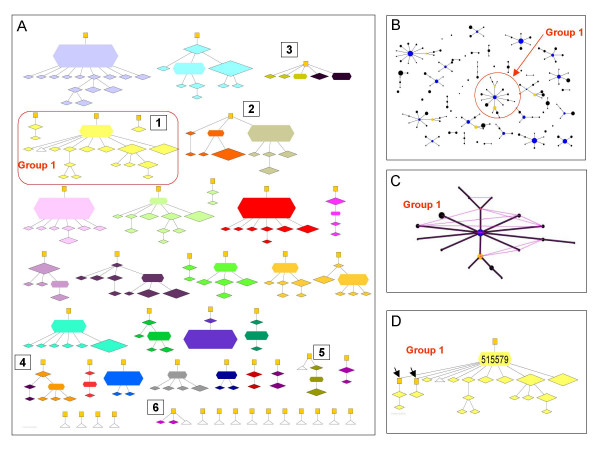
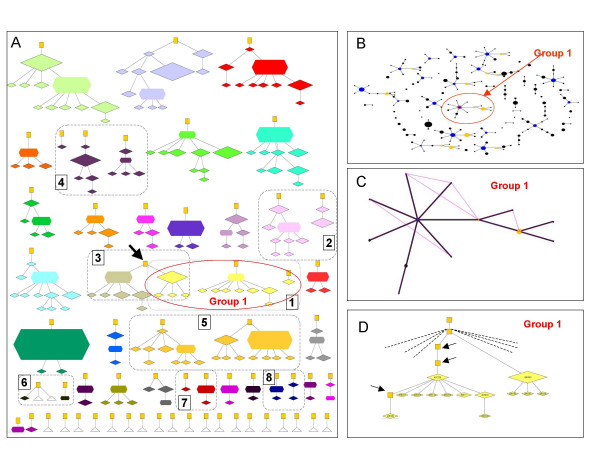
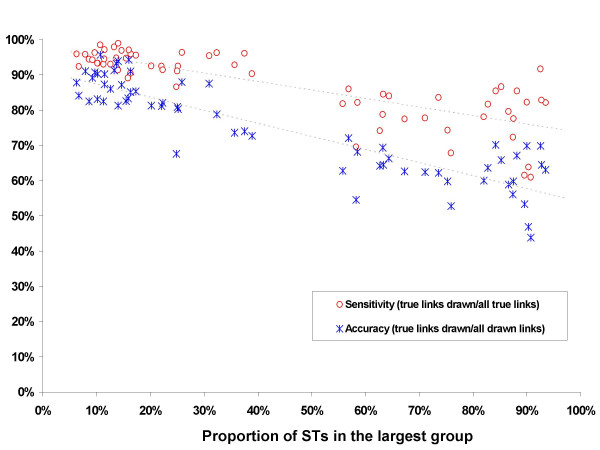
Results: For strictly clonal simulations, where all allelic change is due to point mutation, the groups of related strains identified by eBURST were very similar to those expected from the true ancestry and most of the true ancestor-descendant relationships (90-98%) were identified by eBURST. Populations simulated with low or moderate levels of recombination showed similarly high performance but the reliability of eBURST declined with increasing recombination to mutation ratio. Populations simulated under a high recombination to mutation ratio were dominated by a single large straggly eBURST group, which resulted from the incorrect linking of unrelated groups of strains into the same eBURST group. The reliability of the ancestor-descendant links in eBURST diagrams was related to the proportion of strains in the largest eBURST group, which provides a useful guide to when eBURST is likely to be unreliable.

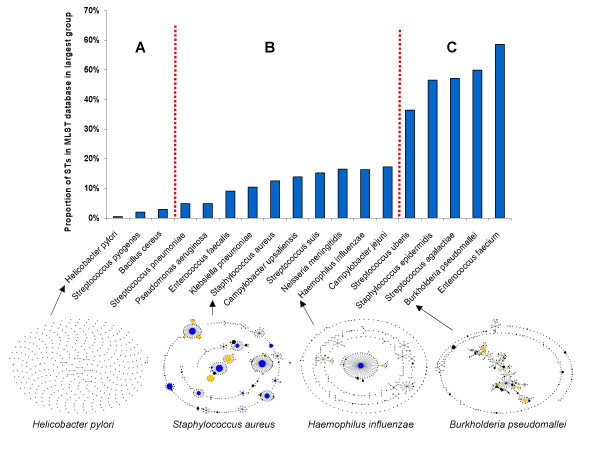
Conclusion: Examination of eBURST groups within populations of a range of bacterial species showed that most were within the range in which eBURST is reliable, and only a small number (e.g. Burkholderia pseudomallei and Enterococcus faecium) appeared to have such high rates of recombination that eBURST is likely to be unreliable. The study also demonstrates how three simple tests in eBURST v3 can be used to detect unreliable eBURST performance and recognise populations in which there appears to be a high rate of recombination relative to mutation.


Figures

Figure 1
Figure 1
Performance of eBURST for populations simulated with and without recombination. The values are the averages and ranges from 20 samples of 500 isolates taken at 500 generation intervals from evolving populations of 1000 isolates with different values of the population mutation (θ) and recombination (ρ) rates.
Figure 2
Figure 2
Relationship between sensitivity and accuracy of eBURST and the recombination to mutation ratio. For each parameter combination, 500 isolates were selected at random from the simulated population of 1000 isolates at 500 generation intervals after equilibrium had been reached. Accuracy and sensitivity are shown for individual samples from the simulations with different combinations of ρ and θ.
Figure 3
Figure 3
Performance of eBURST for a population simulated in the absence of recombination. All 1000 isolates from an equilibrium population, simulated with θ = 10 and ρ = 0, were displayed as A) the true ancestry groups that eBURST attempts to recover and B) eBURST groups. True ancestor-descendant relationships are shown in (A) by lines between the nodes and continuously connected groups of STs define the ancestry groups. The eBURST population snapshot (B) shows the clonal complexes and singletons. The largest eBURST group (Group 1) is labelled. C) Group 1 shows all of the additional SLVs (pink lines) overlaid on the eBURST diagram. D) Complete ancestry of the STs within eBURST Group 1 showing intermediate extinct STs (yellow squares). The isolates descending from the two extinct STs on the left (arrows) are in separate ancestry groups although they are in the same eBURST group (see text and supplementary online information). In A) node size is proportional to the frequency of an ST in the sample, and nodes are coloured by eBURST group. Nodes shaped as hexagons indicate the founders predicted by eBURST; diamonds are sampled STs; yellow squares are extinct ancestors of STs in the population; white triangles are singletons. In eBURST groups, the circles indicate STs and the area of each circle denotes the frequency of the ST. Blue circles denote the predicted founders of eBURST groups, yellow denotes a subgroup founder [11]. Black lines between STs show the inferred evolutionary relationships from the founder to the other STs in the eBURST group. Further description of Figure 3 is available as additional files.
Figure 4
Figure 4
Performance of eBURST for a population simulated with a moderate recombination to mutation ratio. All 1000 isolates from an equilibrium population simulated with ρ = 10, θ = 3 were displayed as ancestry groups (A) and eBURST groups (B). C) The largest eBURST group (Group 1) is shown with all additional SLVs indicated. See Figure 3 for details. Further description of the eight discrepancies (numbered 1–8) between the ancestry groups and eBURST groups is available as additional files.
Figure 5
Figure 5
Performance of eBURST for a population simulated with a high rate of recombination. All 1000 isolates from an equilibrium population simulated with ρ = 10, θ = 1 were displayed as ancestry groups (A) and eBURST groups (B). The large eBURST group (Group 1) includes many unrelated ancestry groups, which are numbered. C) All of the additional SLV links are shown in pink for the largest eBURST group (Group 1). The arrow shows an example of a long-range SLV link. D) The groups of STs within eBURST Group 1 that correspond to the ancestry groups are shown, numbered as in (A). The eBURST group is the same at that in (B), except that subgroups and STs have been moved relative to each other to be able to show better the relationship with the ancestry groups. Arrows show examples of STs within a radial eBURST subgroup that should be in different ancestry groups. See Figure 3 for details. Further description of Figure 5 is available as additional files.
Figure 6
Figure 6
Relationship between the performance of eBURST and the proportion of STs in the largest group. Ten realisations of each simulation were generated with different combinations of ρ and θ. Random samples of 500 isolates were drawn from the population of 1000 isolates at 500 generation intervals after generation 5000.
Figure 7
Figure 7
Proportion of STs in the largest eBURST group for populations of species in the MLST databases. All isolates in the MLST databases for a number of species were obtained from MLST [14] and pubMLST [15] websites and the proportion of STs in the largest eBURST group was calculated. eBURST population snapshots are shown for four selected species with differing proportions of STs in their largest eBURST group. In area A the population is so diverse that clonal complexes may not be apparent (see text), in area B eBURST performance should be good, whereas in area C the performance is likely to be poor due to high levels of recombination.

References

    1. Mazars E, Lesjean S, Banuls AL, Gilbert M, Vincent V, Gicquel B, Tibayrenc M, Locht C, Supply P. High-resolution minisatellite-based typing as a portable approach to global analysis of Mycobacterium tuberculosis molecular epidemiology. Proc Natl Acad Sci U S A. 2001;98:1901–1906. doi: 10.1073/pnas.98.4.1901. - DOI - PMC - PubMed
    1. Farlow J, Smith KL, Wong J, Abrams M, Lytle M, Keim P. Francisella tularensis strain typing using multiple-locus, variable-number tandem repeat analysis. J Clin Microbiol. 2001;39:3186–3192. doi: 10.1128/JCM.39.9.3186-3192.2001. - DOI - PMC - PubMed
    1. Keim P, Price LB, Klevytska AM, Smith KL, Schupp JM, Okinaka R, Jackson PJ, Hugh-Jones ME. Multiple-locus variable-number tandem repeat analysis reveals genetic relationships within Bacillus anthracis. J Bacteriol. 2000;182:2928–2936. doi: 10.1128/JB.182.10.2928-2936.2000. - DOI - PMC - PubMed
    1. Gutacker MM, Smoot JC, Migliaccio CA, Ricklefs SM, Hua S, Cousins DV, Graviss EA, Shashkina E, Kreiswirth BN, Musser JM. Genome-wide analysis of synonymous single nucleotide polymorphisms in Mycobacterium tuberculosis complex organisms: resolution of genetic relationships among closely related microbial strains. Genetics. 2002;162:1533–1543. - PMC - PubMed
    1. Filliol I, Motiwala AS, Cavatore M, Qi W, Hazbon MH, Bobadilla del Valle M, Fyfe J, Garcia-Garcia L, Rastogi N, Sola C, Zozio T, Guerrero MI, Leon CI, Crabtree J, Angiuoli S, Eisenach KD, Durmaz R, Joloba ML, Rendon A, Sifuentes-Osornio J, Ponce de Leon A, Cave MD, Fleischmann R, Whittam TS, Alland D. Global phylogeny of Mycobacterium tuberculosis based on single nucleotide polymorphism (SNP) analysis: insights into tuberculosis evolution, phylogenetic accuracy of other DNA fingerprinting systems, and recommendations for a minimal standard SNP set. J Bacteriol. 2006;188:759–772. doi: 10.1128/JB.188.2.759-772.2006. - DOI - PMC - PubMed

Publication types