

Use of a novel Förster resonance energy transfer method to identify locations of site-bound metal ions in the U2-U6 snRNA complex
- PMID: 17430967
- PMCID: PMC1888832
- DOI: 10.1093/nar/gkm134
Use of a novel Förster resonance energy transfer method to identify locations of site-bound metal ions in the U2-U6 snRNA complex
Abstract
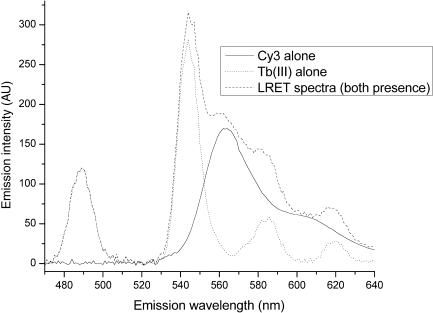
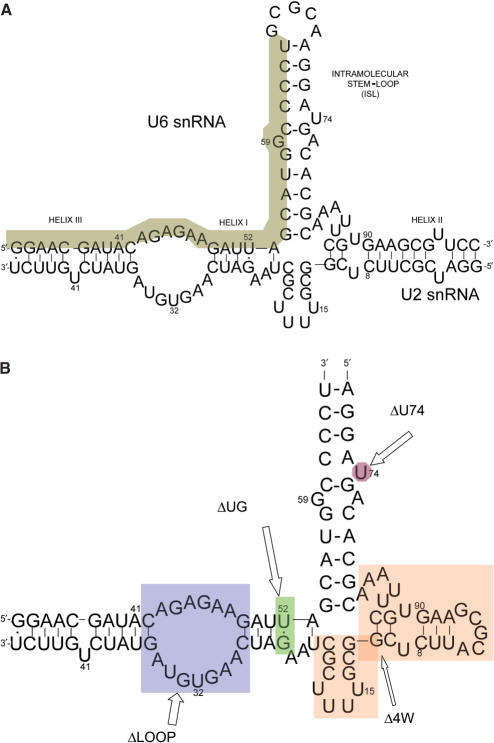
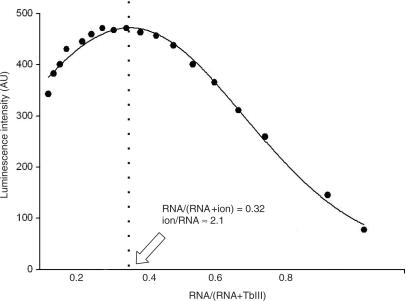
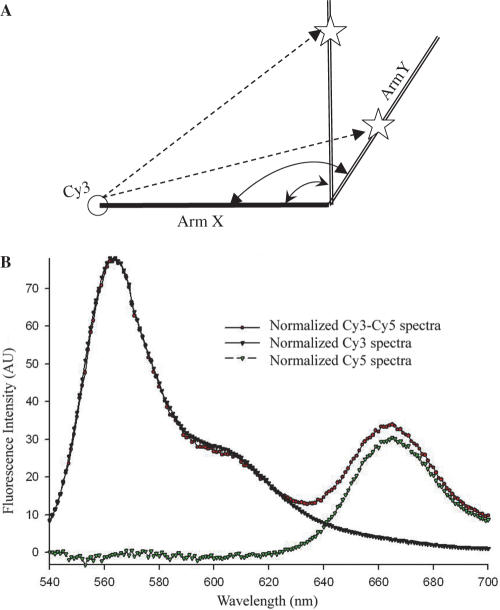
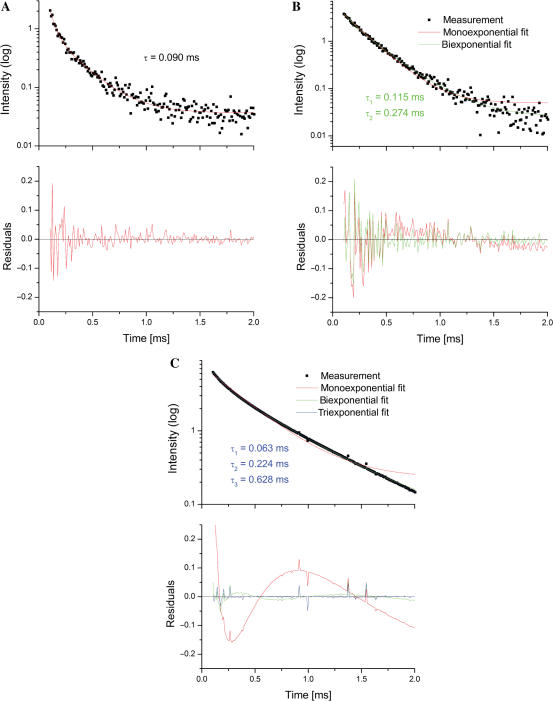
U2 and U6 snRNAs pair to form a phylogenetically conserved complex at the catalytic core of the spliceosome. Interactions with divalent metal ions, particularly Mg(II), at specific sites are essential for its folding and catalytic activity. We used a novel Förster resonance energy transfer (FRET) method between site-bound luminescent lanthanide ions and a covalently attached fluorescent dye, combined with supporting stoichiometric and mutational studies, to determine locations of site-bound Tb(III) within the human U2-U6 complex. At pH 7.2, we detected three metal-ion-binding sites in: (1) the consensus ACACAGA sequence, which forms the internal loop between helices I and III; (2) the four-way junction, which contains the conserved AGC triad; and (3) the internal loop of the U6 intra-molecular stem loop (ISL). Binding at each of these sites is supported by previous phosphorothioate substitution studies and, in the case of the ISL site, by NMR. Binding of Tb(III) at the four-way junction and the ISL sites was found to be pH-dependent, with no ion binding observed below pH 6 and 7, respectively. This pH dependence of metal ion binding suggests that the local environment may play a role in the binding of metal ions, which may impact on splicing activity.
Figures
Similar articles
-
U2-U6 RNA folding reveals a group II intron-like domain and a four-helix junction.Nat Struct Mol Biol. 2004 Dec;11(12):1237-42. doi: 10.1038/nsmb863. Epub 2004 Nov 14. Nat Struct Mol Biol. 2004. PMID: 15543154
-
Structure of the yeast U2/U6 snRNA complex.RNA. 2012 Apr;18(4):673-83. doi: 10.1261/rna.031138.111. Epub 2012 Feb 10. RNA. 2012. PMID: 22328579 Free PMC article.
-
Metal binding and base ionization in the U6 RNA intramolecular stem-loop structure.Nat Struct Biol. 2002 Jun;9(6):431-5. doi: 10.1038/nsb800. Nat Struct Biol. 2002. PMID: 11992125
-
Secondary structure of U6 small nuclear RNA: implications for spliceosome assembly.Biochem Soc Trans. 2010 Aug;38(4):1099-104. doi: 10.1042/BST0381099. Biochem Soc Trans. 2010. PMID: 20659011 Review.
-
Theory Meets Experiment: Metal Ion Effects in HCV Genomic RNA Kissing Complex Formation.Front Mol Biosci. 2017 Dec 22;4:92. doi: 10.3389/fmolb.2017.00092. eCollection 2017. Front Mol Biosci. 2017. PMID: 29312955 Free PMC article. Review.
Cited by
-
CHSalign: A Web Server That Builds upon Junction-Explorer and RNAJAG for Pairwise Alignment of RNA Secondary Structures with Coaxial Helical Stacking.PLoS One. 2016 Jan 20;11(1):e0147097. doi: 10.1371/journal.pone.0147097. eCollection 2016. PLoS One. 2016. PMID: 26789998 Free PMC article.
-
Conformational heterogeneity of the protein-free human spliceosomal U2-U6 snRNA complex.RNA. 2013 Apr;19(4):561-73. doi: 10.1261/rna.038265.113. Epub 2013 Feb 20. RNA. 2013. PMID: 23426875 Free PMC article.
-
Single-molecule analysis of protein-free U2-U6 snRNAs.Nat Struct Mol Biol. 2009 Nov;16(11):1154-9. doi: 10.1038/nsmb.1672. Epub 2009 Nov 1. Nat Struct Mol Biol. 2009. PMID: 19881500 Free PMC article.
-
Evolutionarily divergent spliceosomal snRNAs and a conserved non-coding RNA processing motif in Giardia lamblia.Nucleic Acids Res. 2012 Nov;40(21):10995-1008. doi: 10.1093/nar/gks887. Epub 2012 Sep 27. Nucleic Acids Res. 2012. PMID: 23019220 Free PMC article.
-
Metal binding and substrate positioning by evolutionarily invariant U6 sequences in catalytically active protein-free snRNAs.RNA. 2010 Nov;16(11):2226-38. doi: 10.1261/rna.2170910. Epub 2010 Sep 8. RNA. 2010. PMID: 20826700 Free PMC article.
References
-
- Brow DA. Allosteric cascade of spliceosome activation. Annu. Rev. Genet. 2002;36:333–360. - PubMed
-
- Datta B, Weiner AM. Genetic evidence for base pairing between U2 and U6 snRNA in mammalian mRNA splicing. Nature. 1991;352:821–824. - PubMed
-
- Wu JA, Manley JL. Base pairing between U2 and U6 snRNAs is necessary for splicing of a mammalian pre-mRNA. Nature. 1991;352:818–821. - PubMed
-
- Madhani HD, Guthrie C. A novel base-pairing interaction between U2 and U6 snRNAs suggests a mechanism for the catalytic activation of the spliceosome. Cell. 1992;71:803–817. - PubMed
-
- Madhani HD, Guthrie C. Randomization-selection analysis of snRNAs in vivo: evidence for a tertiary interaction in the spliceosome. Genes. Dev. 1994;8:1071–1086. - PubMed
