

Plastidial fatty acid levels regulate resistance gene-dependent defense signaling in Arabidopsis
- PMID: 17431038
- PMCID: PMC1855359
- DOI: 10.1073/pnas.0609259104
Plastidial fatty acid levels regulate resistance gene-dependent defense signaling in Arabidopsis
Abstract
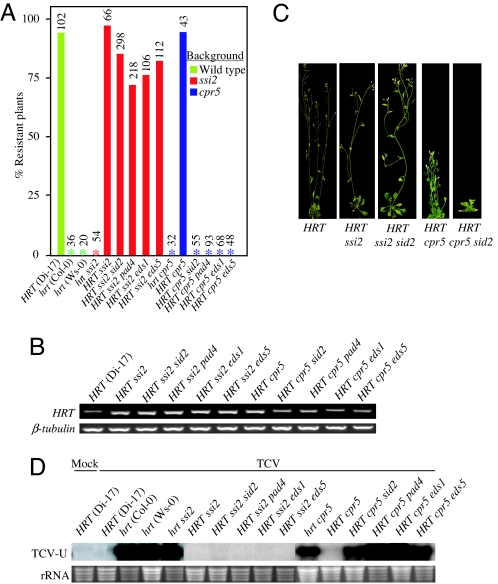
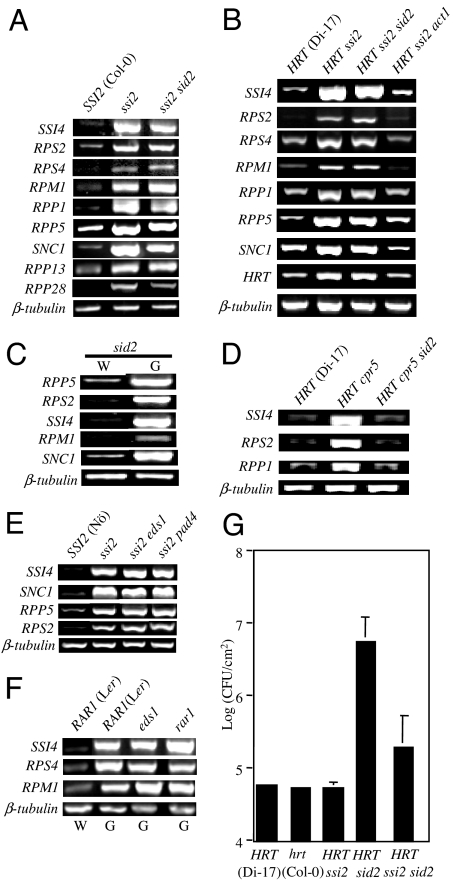
In Arabidopsis, resistance to Turnip Crinkle Virus (TCV) depends on the resistance (R) gene, HRT, and the recessive locus rrt. Resistance also depends on salicylic acid (SA), EDS1, and PAD4. Exogenous application of SA confers resistance in RRT-containing plants by increasing HRT transcript levels in a PAD4-dependent manner. Here we report that reduction of oleic acid (18:1) can also induce HRT gene expression and confer resistance to TCV. However, the 18:1-regulated pathway is independent of SA, rrt, EDS1, and PAD4. Reducing the levels of 18:1, via a mutation in the SSI2-encoded stearoyl-acyl carrier protein-desaturase, or by exogenous application of glycerol, increased transcript levels of HRT as well as several other R genes. Second-site mutations in the ACT1-encoded glycerol-3-phosphate acyltransferase or GLY1-encoded glycerol-3-phosphate dehydrogenase restored 18:1 levels in HRT ssi2 plants and reestablished a dependence on rrt. Resistance to TCV and HRT gene expression in HRT act1 plants was inducible by SA but not by glycerol, whereas that in HRT pad4 plants was inducible by glycerol but not by SA. The low 18:1-mediated induction of R gene expression was also dependent on ACT1 but independent of EDS1, PAD4, and RAR1. Intriguingly, TCV inoculation did not activate this 18:1-regulated pathway in HRT plants, but instead resulted in the induction of several genes that encode 18:1-synthesizing isozymes. These results suggest that the 18:1-regulated pathway may be specifically targeted during pathogen infection and that altering 18:1 levels may serve as a unique strategy for promoting disease resistance.
Conflict of interest statement
The authors declare no conflict of interest.
Figures


Similar articles
-
SAG101 forms a ternary complex with EDS1 and PAD4 and is required for resistance signaling against turnip crinkle virus.PLoS Pathog. 2011 Nov;7(11):e1002318. doi: 10.1371/journal.ppat.1002318. Epub 2011 Nov 3. PLoS Pathog. 2011. PMID: 22072959 Free PMC article.
-
Signaling requirements and role of salicylic acid in HRT- and rrt-mediated resistance to turnip crinkle virus in Arabidopsis.Plant J. 2004 Dec;40(5):647-59. doi: 10.1111/j.1365-313X.2004.02241.x. Plant J. 2004. PMID: 15546349
-
Plastidial fatty acid signaling modulates salicylic acid- and jasmonic acid-mediated defense pathways in the Arabidopsis ssi2 mutant.Plant Cell. 2003 Dec;15(12):2952-65. doi: 10.1105/tpc.017301. Epub 2003 Nov 13. Plant Cell. 2003. PMID: 14615603 Free PMC article.
-
Plant immunity: the EDS1 regulatory node.Curr Opin Plant Biol. 2005 Aug;8(4):383-9. doi: 10.1016/j.pbi.2005.05.010. Curr Opin Plant Biol. 2005. PMID: 15939664 Review.
-
TIR-mediated immune signaling through the EDS1:PAD4:ADR1 node is conserved in monocots and dicots.Mol Plant. 2025 Feb 3;18(2):192-194. doi: 10.1016/j.molp.2024.12.017. Epub 2024 Dec 31. Mol Plant. 2025. PMID: 40420534 Review.
Cited by
-
The common metabolite glycerol-3-phosphate is a novel regulator of plant defense signaling.Plant Signal Behav. 2009 Aug;4(8):746-9. doi: 10.4161/psb.4.8.9111. Epub 2009 Aug 25. Plant Signal Behav. 2009. PMID: 19820353 Free PMC article.
-
A Novel Glycerol Kinase Gene OsNHO1 Regulates Resistance to Bacterial Blight and Blast Diseases in Rice.Front Plant Sci. 2022 Jan 20;12:800625. doi: 10.3389/fpls.2021.800625. eCollection 2021. Front Plant Sci. 2022. PMID: 35126424 Free PMC article.
-
SAG101 forms a ternary complex with EDS1 and PAD4 and is required for resistance signaling against turnip crinkle virus.PLoS Pathog. 2011 Nov;7(11):e1002318. doi: 10.1371/journal.ppat.1002318. Epub 2011 Nov 3. PLoS Pathog. 2011. PMID: 22072959 Free PMC article.
-
Signal regulators of systemic acquired resistance.Front Plant Sci. 2015 Apr 13;6:228. doi: 10.3389/fpls.2015.00228. eCollection 2015. Front Plant Sci. 2015. PMID: 25918514 Free PMC article.
-
Loss of the transit peptide and an increase in gene expression of an ancestral chloroplastic carbonic anhydrase were instrumental in the evolution of the cytosolic C4 carbonic anhydrase in Flaveria.Plant Physiol. 2009 Jul;150(3):1515-29. doi: 10.1104/pp.109.137513. Epub 2009 May 15. Plant Physiol. 2009. PMID: 19448040 Free PMC article.
References
Publication types
MeSH terms
Substances
LinkOut - more resources
Full Text Sources
Molecular Biology Databases
Research Materials
