. 2007 May 16;26(10):2465-76.
doi: 10.1038/sj.emboj.7601686. Epub 2007 Apr 12.

The Golgi mitotic checkpoint is controlled by BARS-dependent fission of the Golgi ribbon into separate stacks in G2

Affiliations

The Golgi mitotic checkpoint is controlled by BARS-dependent fission of the Golgi ribbon into separate stacks in G2

Antonino Colanzi et al. EMBO J. .

Abstract

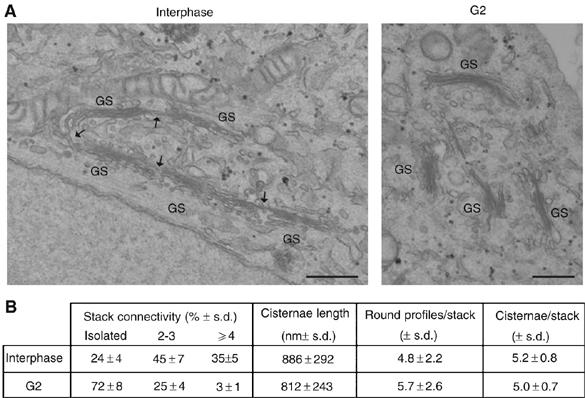
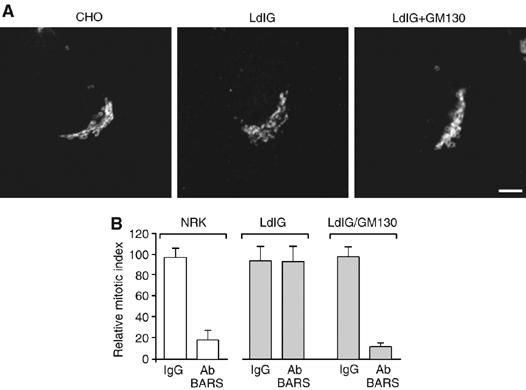
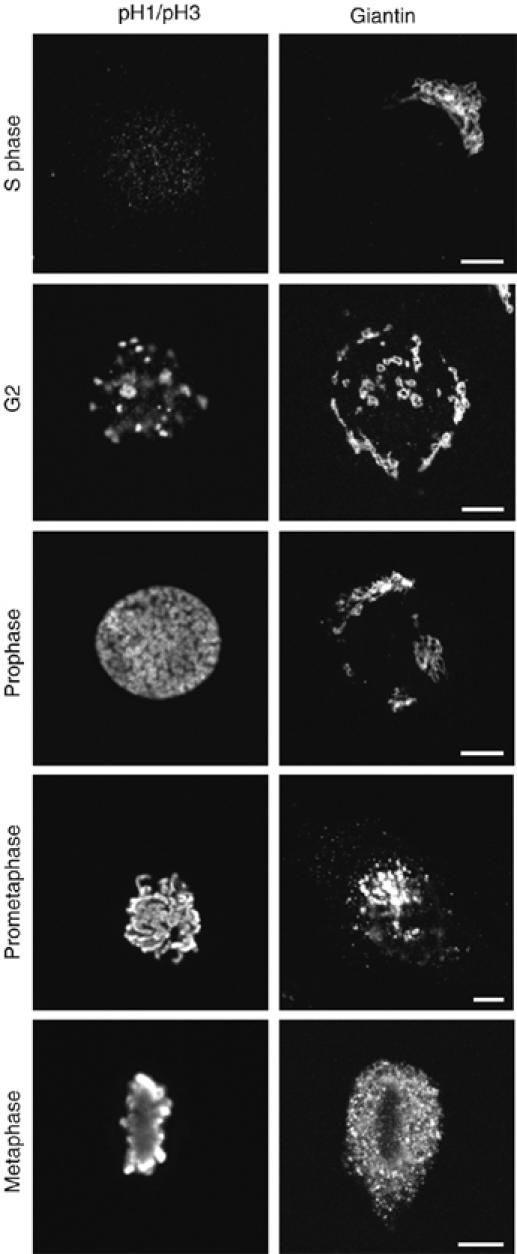
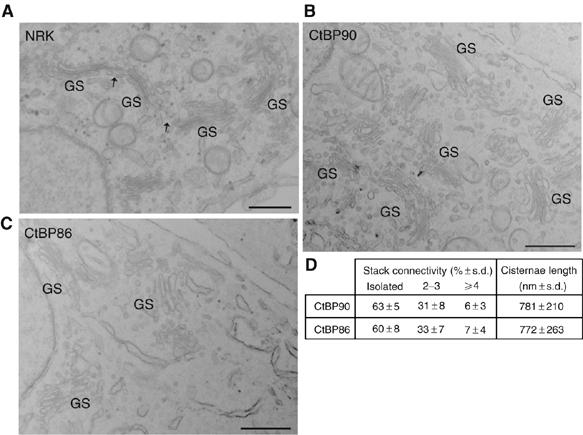
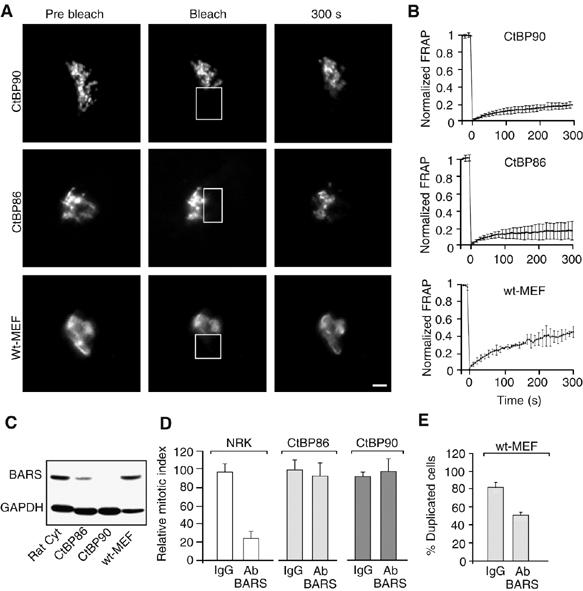
The Golgi ribbon is a complex structure of many stacks interconnected by tubules that undergo fragmentation during mitosis through a multistage process that allows correct Golgi inheritance. The fissioning protein CtBP1-S/BARS (BARS) is essential for this, and is itself required for mitotic entry: a block in Golgi fragmentation results in cell-cycle arrest in G2, defining the 'Golgi mitotic checkpoint'. Here, we clarify the precise stage of Golgi fragmentation required for mitotic entry and the role of BARS in this process. Thus, during G2, the Golgi ribbon is converted into isolated stacks by fission of interstack connecting tubules. This requires BARS and is sufficient for G2/M transition. Cells without a Golgi ribbon are independent of BARS for Golgi fragmentation and mitotic entrance. Remarkably, fibroblasts from BARS-knockout embryos have their Golgi complex divided into isolated stacks at all cell-cycle stages, bypassing the need for BARS for Golgi fragmentation. This identifies the precise stage of Golgi fragmentation and the role of BARS in the Golgi mitotic checkpoint, setting the stage for molecular analysis of this process.


Figures

Figure 1
Figure 1
Morphology of Golgi membranes in HeLa cells through the cell cycle. (A) HeLa cells were grown on coverslips and fixed and labelled with anti-phosphohistone-H1 and -H3 polyclonal antibodies (pH1/pH3) as markers of different cell-cycle phases (Hidalgo Carcedo et al, 2004), and with a giantin antibody to label the Golgi complex. Images were acquired using a confocal microscope set at maximal resolution. For quantitative analysis of Golgi phenotypes, fixed imaging conditions were applied to all of the images. Scale bar, 5 μm. (B) Percent distribution of Golgi phenotypes as described in Materials and methods. Data shown are representative of a total of 70–120 cells for each experimental condition across three independent experiments.
Figure 2
Figure 2
Ultrastructure of Golgi membranes during G2 and interphase. (A) Non-treated HeLa cells and HeLa cells induced to accumulate in G2 with bisbenzimide were processed for electron microscopy. Representative images of thin sections of non-treated (interphase) and G2-blocked (G2) cells are shown. Note that Golgi membranes are organized as stacks (GS) connected by non-compact zones (arrows) in non-synchronized HeLa cells, and as isolated stacks (GS) during G2. Scale bar, 0.5 μm. (B) Morphometric analysis of the ribbon extension in thin sections from non-treated (interphase) and G2-blocked HeLa cells (G2), as indicated. Stack connectivity represents the relative percent distribution of Golgi stacks found isolated, in groups of 2–3 or of at least four connected stacks. The data are representative of more than 80 Golgi containing sections for each experimental condition in three independent experiments.
Figure 3
Figure 3
BARS mediates fission of the Golgi ribbon during G2. (A–C) HeLa cells were transfected with GalT-GFP and left non-treated (interphase/Int) or were induced to accumulate in G2 with bisbenzimide (C, G2 blocked). They were then mock microinjected (G2(−)) or microinjected with BARS-DN SBD (G2+SBD/SBD) and fluorescent dextran as microinjection marker and subjected to FRAP analysis after bleaching about 50% of the Golgi mass. (A) Representative images of GalT-GFP HeLa cells before bleaching (Pre-bleach), at the end of bleaching (Bleach) and 300 s after bleaching (300 s). The bleached areas are delineated by white-bordered rectangles. Scale bar, 5 μm. (B) Time courses of FRAP of interphase (top), G2 (middle) and BARS-DN-SBD-microinjected G2 (bottom) cells illustrated in (A). Fluorescence intensities in bleached areas were monitored every 5 s. Recovery curves of fluorescence intensities are normalized to non-bleached areas and corrected for background versus times. (C) Mean FRAP (±s.d.) 300 s after bleaching. Data are from analysis of 18–20 cells for each condition, and from four independent experiments performed as in (A). Statistical significances were evaluated by Student's t-test: (a) versus (b), P<0.0005; (b) versus (c), P<0.008 and (a) versus (c), P<0.03. (D) HeLa cells were transfected with GalT-GFP and left overnight non-treated (Int) or to accumulate in S phase with aphidicolin (G2 enriched). Eleven to thirteen hours after aphidicolin washout, the G2-enriched cells were microinjected with recombinant GST (8 mg/ml) (GST), recombinant BARS-DN SBD (8 mg/ml) (SBD) or the p50-2 anti-BARS antibody (3–6 mg/ml) (Ab), with fluorescent dextran as microinjection marker. Finally, the cells were subjected to FRAP after bleaching 15–20% of the Golgi mass. Mean FRAP (±s.d.) measured 300 s after bleaching and derived from 32–38 cells for each experimental condition, from five independent experiments. Statistical significances evaluated by Student's-t test: (a) versus (b), P<0.0001; (b) versus (c), P<0.0001; (b) vs (d), P<0.0001 and (a) versus (c), P<0.2. (E) HeLa cells arrested in S phase using aphidicolin (Hidalgo Carcedo et al, 2004). After 1 h, cells were microinjected with recombinant GST (8 mg/ml), generic IgG (3-6 mg/ml), recombinant BARS-DN SBD (8 mg/ml) (SBD) or the p50-2 anti-BARS antibody (3–6 mg/ml) (Ab), with FITC-conjugated dextran as microinjection marker; after 13 h, they were fixed and labelled for cell-cycle phase (Hoechst 33258; not shown), as detailed in (Hidalgo Carcedo et al, 2004). More than 200 cells were microinjected for each condition. The relative mitotic index was calculated after measuring the percentages of microinjected cells in mitosis normalized to non-microinjected cells on the same coverslip. Means (±s.d.) from three independent experiments.
Figure 4
Figure 4
Inhibition of BARS does not affect progression into mitosis in cells that do not possess an intact Golgi ribbon. (A) CHO, LdlG (CHO cells defective in GM130 expression) and LdlG/GM130 (LdlG cells stably expressing GM130) cells (as indicated) were fixed and treated for immunofluorescence microscopy. The structure of the Golgi complex was monitored using an anti-giantin antibody. Scale bar, 5 μm. (B) NRK (normal rat kidney), LdlG and LdlG/GM130 cells (as indicated) arrested in S phase using aphidicolin (Hidalgo Carcedo et al, 2004). After 1 h, cells were microinjected with generic IgG (3–6 mg/ml; IgG) or the p50-2 BARS antibody (3–6 mg/ml; Ab). After a further 7 h (NRK) or 14 h (LdlG and LdlG/GM130), cells were fixed and labelled for microinjection (goat antibody to rabbit IgG; not shown) and cell-cycle phase (Hoechst 33258; not shown), as detailed in (Hidalgo Carcedo et al, 2004). More than 200 NRK and 600 LdlG and LdlG/GM130 cells were microinjected per sample. The relative mitotic index was calculated after measuring the percentage of microinjected cells in mitosis normalized to non-microinjected cells on the same coverslip. Means (±s.d.) from three independent experiments.
Figure 5
Figure 5
Morphology of Golgi membranes in CtBP90 cells through the cell cycle. CtBP90 cells were grown on coverslips and fixed and labelled with anti-phospho-histone-H1 and -H3 polyclonal antibodies (pH1/pH3) as markers of different cell-cycle phases (Hidalgo Carcedo et al, 2004), and with an anti-giantin antibody to label the Golgi complex. Images were acquired using confocal microscope set at maximal resolution. Images shown are representative of three independent experiments. Scale bar, 5 μm.
Figure 6
Figure 6
Ultrastructure of Golgi membranes in CtBP90 and CtBP86 cells. (A–C) NRK, CtBP90 and CtBP86 cells were processed for electron microscopy. Representative images of thin sections of NRK (A) CtBP90 (B) and CtBP86 (C) and cells are shown. Note that the Golgi membranes are organized as a continuous ribbon, composed of stacks (GS) and non-compact zones (arrows) in NRK cells, whereas they are organized as isolated and non-aligned stacks (GS) in CtBP90 and CtBP86 cells. (D) Morphometric analysis of the ribbon extension in thin sections from CtBP90 and CtBP86 cells, as indicated. Stack connectivity represents the relative percent distribution of Golgi stacks found isolated, in groups of 2–3 or of at least four connected stacks. Images are representative of more that 60 Golgi-containing sections from three independent experiments. Scale bar, 0.5 μm.
Figure 7
Figure 7
Inhibition of BARS does not affect entry into mitosis in CtBP90 cells, which are organized in the form of isolated stacks. Cells were transfected with GalT-GFP and subjected to FRAP analysis after bleaching 50% of the Golgi mass. (A) Representative images of GalT-GFP in CtBP86, CtBP90 and wild-type (wt)-MEF cells before bleaching (prebleach), immediately after bleaching (bleach) and 300 s after bleaching (300 s). Bleached areas are shown by white-bordered rectangles. Fluorescence intensities in bleached areas were monitored every 5 s. Recovery curves of fluorescence intensities were normalized to unbleached areas and corrected for background versus time. Scale bar, 5 μm. (B) Mean time courses of FRAP (±s.d.) from 20–32 cells from four independent experiments preformed as indicated in (A) with CtBP86 (top), CtBP90 (middle) and wild-type (bottom; wt) MEFs. Fluorescence intensities in bleached areas were monitored every 5 s. Recovery curves of fluorescence intensities are normalized to non-bleached areas and corrected for background versus times. (C) Cytosols prepared from rat brain cytosol (rat cyt.), CtBP86 and CtBP90 MEFs, and wt-MEFs (30 μg per lane) were analyzed by immunoblotting using the anti-BARS antibody (BARS) and an anti-GAPDH antibody (GAPDH) as reference. (D) Cells were arrested in S phase with 2 mM thymidine (see Materials and methods and (Hidalgo Carcedo et al, 2004)). After 1 h, cells were microinjected with generic IgG (3–6 mg/ml) or the p50-2 BARS antibody (3–6 mg/ml; Ab BARS). After a further 7 h (NRK) or 8 h (CtBP86 and CtBP90), cells were fixed and labelled for microinjected cells (goat antibody to rabbit IgG; not shown) and cell-cycle phase (Hoechst 33258; not shown) as detailed in (Hidalgo Carcedo et al, 2004). More than 200 NRK and 600 CtBP86 and CtBP90 MEFs were microinjected per sample. The relative mitotic index was calculated after measuring the percentage of microinjected cells in mitosis normalized to non-microinjected cells on the same coverslip. Means (±s.d.) from four independent experiments. (E) Unsynchronized wt-MEFs were microinjected with generic IgG (2–4 mg/ml) or the p50-2 anti-BARS antibody (2-4 mg/ml; Ab BARS) in the presence of fluorescent dextran as microinjection marker. Cells were fixed 12 h after injection and labelled for microinjected cells (goat antibody to rabbit IgG), cell-cycle phase (Hoechst 33258) and scored for the number of duplicated cells. The percentages of duplicated cells that were microinjected with IgG or the anti-BARS antibody are shown. More than 200 wt-MEF cells were microinjected per sample. Means (±s.d.) from four independent experiments.

Similar articles

Cited by

References

    1. Acharya U, Mallabiabarrena A, Acharya JK, Malhotra V (1998) Signaling via mitogen-activated protein kinase kinase (MEK1) is required for Golgi fragmentation during mitosis. Cell 92: 183–192 - PubMed
    1. Allan VJ, Thompson HM, McNiven MA (2002) Motoring around the Golgi. Nat Cell Biol 4: E236–242 - PubMed
    1. Altan-Bonnet N, Phair RD, Polishchuk RS, Weigert R, Lippincott-Schwartz J (2003) A role for Arf1 in mitotic Golgi disassembly, chromosome segregation, and cytokinesis. Proc Natl Acad Sci USA 100: 13314–13319 - PMC - PubMed
    1. Altan-Bonnet N, Sougrat R, Liu W, Snapp EL, Ward T, Lippincott-Schwartz J (2006) Golgi inheritance in mammalian cells is mediated through endoplasmic reticulum export activities. Mol Biol Cell 17: 990–1005 - PMC - PubMed
    1. Axelsson MA, Warren G (2004) Rapid, endoplasmic reticulum-independent diffusion of the mitotic Golgi haze. Mol Biol Cell 15: 1843–1852 - PMC - PubMed

Publication types

MeSH terms

Substances