. 2007 May 2;26(9):2371-86.
doi: 10.1038/sj.emboj.7601680. Epub 2007 Apr 12.

The neural EGF family member CALEB/NGC mediates dendritic tree and spine complexity

Affiliations

The neural EGF family member CALEB/NGC mediates dendritic tree and spine complexity

Nicola Brandt et al. EMBO J. .

Abstract

The development of dendritic arborizations and spines is essential for neuronal information processing, and abnormal dendritic structures and/or alterations in spine morphology are consistent features of neurons in patients with mental retardation. We identify the neural EGF family member CALEB/NGC as a critical mediator of dendritic tree complexity and spine formation. Overexpression of CALEB/NGC enhances dendritic branching and increases the complexity of dendritic spines and filopodia. Genetic and functional inactivation of CALEB/NGC impairs dendritic arborization and spine formation. Genetic manipulations of individual neurons in an otherwise unaffected microenvironment in the intact mouse cortex by in utero electroporation confirm these results. The EGF-like domain of CALEB/NGC drives both dendritic branching and spine morphogenesis. The phosphatidylinositide 3-kinase (PI3K)-Akt-mammalian target of rapamycin (mTOR) signaling pathway and protein kinase C (PKC) are important for CALEB/NGC-induced stimulation of dendritic branching. In contrast, CALEB/NGC-induced spine morphogenesis is independent of PI3K but depends on PKC. Thus, our findings reveal a novel switch of specificity in signaling leading to neuronal process differentiation in consecutive developmental events.


Figures
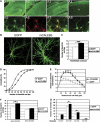
Figure 1
Figure 1
CALEB/NGC is expressed in hippocampal and neocortical neurons and increases dendritic arborizations. (A) A section of adult rat hippocampus was stained by indirect immunofluorescence with an antibody to CALEB/NGC (green, A1). In a high-magnification view of the CA1 region (A2) CALEB/NGC staining was found predominantly in fiber-rich areas. CALEB/NGC was also present in P10 mouse hippocampus (A3) and cortex (A4). When hippocampal cells in culture at DIV9 were probed with two different anti-CALEB/NGC antibodies (A5, A8), cell bodies and dendrites were clearly decorated. Anti-microtubule-associated protein 2 (MAP2) antibody stainings (red, A6) and overlay of anti-CALEB/NGC and MAP2 stainings (A7) confirmed dendritic localization of CALEB/NGC. (B) Examples of hippocampal neurons in culture transfected at DIV7 with either EGFP-encoding (left panel) or mCALEBb-encoding plasmid (right panel) and analyzed at DIV7+2. (C) Quantification of TNDET of hippocampal neurons transfected as described above; n=150, ***P<0.0001. (D) Cumulative frequency plot of TNDET in neurons examined as described. (E) Neurons transfected as described above were analyzed by Sholl analysis; n=15, **P<0.001, *P<0.01. (F, G) Effect of CALEB/NGC on total number of apical and basal dendritic branches (F) and on higher order dendritic branches (G); n=32, **P<0.005, *P<0.05. Scale bars, 200 μm (A1), 80 μm (A2), 150 μm (A3, A4), 25 μm (A5–A8), 15 μm (B). CA, cornu ammonis; DG, dentate gyrus; Cx, cortex.
Figure 2
Figure 2
Knockdown of CALEB/NGC reduces dendritic tree complexity. (A, B) Hippocampal neurons in culture were transfected at DIV9 with the shRNA constructs CAL1sh (A) and CAL3sh (B) and analyzed 3 days later. A GFP staining was performed to visualize neuron morphology (A1 and A2 green, B1–B5 green). Endogenous CALEB/NGC expression was shown by staining of the culture with the anti-CSPG5 monoclonal antibody (A1 and A2 red, B1–B5 red, arrows label transfected neurons), which recognizes an epitope in the cytoplasmic domain of CALEB/NGC (see Materials and methods). (C) Quantification of TNDET of hippocampal neurons transfected as described above; n=40, ***P<0.0001. (D) Western blot of mCALEBb levels in HEK293 cells co-transfected with control shRNA construct CAL1sh or CALEB/NGC-specific shRNA construct CAL3sh and mCALEBb-encoding plasmid. The immunoblot performed 24 h after transfection was probed with either anti-FLAG antibody or anti-β-tubulin antibody (loading control). Both the mCALEBb band (doublet, arrows) and the proteoglycan variant of CALEB/NGC (*) were stained. (E) Western blot of endogenous CALEB/NGC levels in primary hippocampal neurons transfected at DIV10 with control siRNA CAL1 or CALEB/NGC-specific siRNA CAL3 and analyzed 2 days later. The immunoblot was probed with either anti-CALEB/NGC monoclonal antibody (BD Biosciences) or anti-β-tubulin antibody (loading control). Both the CALEB/NGC band (doublet, arrow) and the proteoglycan variant of CALEB/NGC (*) were stained. (F) Quantification of relative fluorescence intensities of cell bodies of hippocampal neurons transfected with the indicated siRNA constructs at DIV10 and analyzed at DIV10+2 after CALEB/NGC staining; n=30, *P<0.05 and **P<0.01. AU, arbitrary units. (G) Quantification of TNDET in neurons transfected as in (F); n=150, *P<0.05. Scale bar, 20 μm.
Figure 3
Figure 3
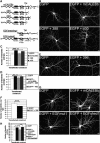
The EGF-like domain and a specific cytoplasmic peptide segment of CALEB/NGC are important for increasing dendritic tree complexity. (A) Scheme of transfected CALEB/NGC-derived constructs. EGF, EGF-like domain; acidic, acidic peptide segment; TM, transmembrane region. (A) Juxtamembrane cytoplasmic peptide segment of CALEB/NGC shown to bind to the PDZ protein PIST; (B) peptide segment shown to be necessary for CALEB/NGC-induced dendritic branching; (C) peptide segment generated due to alternative splicing; (D) peptide segment of unknown function. (B) Cultured hippocampal neurons were co-transfected at DIV7 with EGFP-encoding plasmid and different CALEB/NGC-derived constructs shown schematically in (A). Neurons were analyzed at DIV7+2 after staining for GFP. (C) Quantification of TNDET of transfected cells (performed as described in Figure 1; n=42; ***P<0.0001 and **P<0.005). (D) Quantification of TNDET of neurons co-transfected as described in (B); n=45, **P<0.01. (E) Neurons were transfected at DIV12 to express EGFP or co-express EGFP and CALEB/NGC-derived construct ‘396', and analyzed 2 days later after staining for GFP. (F) Quantification of TNDET of of neurons co-transfected as described in (B); n=90, ***P<0.001. (G) Hippocampal neurons were co-transfected with the indicated constructs and analyzed as described in (B). (H) Quantification of TNDET; n=40, ***P<0.0001. Scale bar, 25 μm.
Figure 4
Figure 4
CALEB/NGC stimulates dendritic tree complexity in mouse cortex. (A) E15.5 mouse embryos were electroporated in utero with the pCLEG vector driving GFP expression. Overview of a coronal section (70 μm thick) stained with an antibody to GFP (A1), and two examples of individual neurons of these electroporated animals (A2, A3). (B) In utero electroporation was performed with a construct driving mCALEBb and GFP expression. Pictures of this animal corresponding to A1–A3 are presented in B1–B3. (C) In utero electroporation was done with the CALEB/NGC-derived construct ‘396' cloned into the pCLEG vector to drive expression of construct ‘396' and GFP. Pictures of this animal corresponding to A1–A3 are presented in C1–C3. (D) The CAL3sh knockdown construct specific to CALEB/NGC cloned into the pCGLH vector that drives GFP expression was electroporated in utero into cortical layer II and III neurons. Pictures of this animal corresponding to A1–A3 are presented in D1–D3. (E) Pictures derived from an animal electroporated with shRNA control construct CAL1sh corresponding to A1–A3 are shown in E1–E3. (F) Expression control of mCALEBb and construct ‘396' with an antibody to the FLAG epitope. (G) Quantification of TNDET of pyramidal neurons in tissue sections of in utero electroporated animals. End tips of dendritic branches longer than 8 μm were counted; n=40, **P<0.01, ***P<0.001. Arrows in A1, B1, C1, D1, and E1 indicate cortical layers 1–3; asterisks in A1, B1, C1, D1, and E1 mark the corpus callosum, arrowheads in A2–E3 point to representative neurons. Scale bars, 80 μm (A1, B1, C1, D1, and E1), 15 μm (A2–E3).
Figure 5
Figure 5
The PI3K-Akt-mTOR pathway is important for CALEB/NGC-induced increase in dendritic tree complexity. (A) Overall view of DIV9 hippocampal neurons transfected at DIV7 either with EGFP- (left panels) or mCALEBb-encoding plasmid (right panels) and treated with indicated concentrations of inhibitors which were added 3 h after transfection. (B) Quantification of TNDET of neurons treated with or without 20 μM LY294002; n=81, ***P<0.0001. (C) Quantification of TNDET of neurons treated with or without 10 μM Akt inhibitor I or 25 μM Akt inhibitor III; n=87 for Akt inhibitor I, n=49 for Akt inhibitor III, ***P<0.0001, *P<0.05. (D) Quantification of TNDET of neurons treated with or without 10 or 100 nM rapamycin (R); n=53, ***P<0.0001, *P<0.05. (E) Quantification of TNDET of neurons treated with or without 10 μM U0126; n=124, ***P<0.005. (F) Western blot of detergent extracts of DIV7 hippocampal neurons treated with or without 10 μM U0126 for 2 days and stained with anti-Phospho-p44/42MAPK or anti-p44/42MAPK antibodies. Scale bar, 25 μm.
Figure 6
Figure 6
CALEB/NGC stimulates dendritic tree complexity independent of electrical activity but dependent on PKC. (A) Overall view of DIV9 hippocampal neurons transfected at DIV7 either with EGFP- (left panels) or mCALEBb-encoding plasmid (right panels) and treated with the indicated concentrations of inhibitors which were added 3 h after transfection. (B) Quantification of TNDET of neurons treated with or without activity inhibitor cocktail (1 μM TTX, 50 μm D-APV and 10 μm nifedipine); n=31 (mCALEBb+cocktail), n=75 (all others), ***P<0.0005. (C) Quantification of TNDET of neurons treated with or without 10 μM hypericin; n=91, ***P<0.0005, *P<0.05. (D) Quantification of TNDET of neurons treated with or without 1 or 10 μM BIM; n (1 μM BIM)=66, n (10 μM BIM)=31, ***P<0.001, **P<0.01. Scale bars, 25 μm.
Figure 7
Figure 7
Enhanced CALEB/NGC expression increases density and complexity of dendritic spines and filopodia. (A) Probing hippocampal cells in culture at DIV16 with an antibody to CALEB/NGC demonstrated strong expression in dendritic processes (green, left panel). A higher magnification view (right panel) of an overlay of CALEB/NGC (green) and MAP2 staining (red, middle and right panels) showed CALEB/NGC to be located in both dendritic spines and filopodia (arrows). (B, C) Hippocampal cells in culture were either transfected at DIV12 with EGFP- (left panels in B and C) or co-transfected with EGFP- and mCALEBb-encoding plasmids (middle and right panels in B and C), and examined at DIV12+4 after staining for GFP (left and middle panels in B and C) or CALEB/NGC (right panels in B and C). (D) Quantification of spine and filopodia length in neurons transfected as described above; 1080 spines and filopodia ⩽4.5 μm of 14 neurons examined for each construct; ***P<0.0001. (E) Quantification of spine and filopodia density (number per 10 μm); 1080 spines and filopodia ⩽4.5 μm of 14 neurons examined for each construct; ***P<0.0001. (F) Quantification of spine and filopodia branch density (number of branch points per 100 μm; branch points of spines and filopodia ⩽4.5 μm of 2700 μm dendrite length of 14 neurons were counted; ***P<0.0001. Scale bars, 35 μm (A, left and middle panel), and 6 μm (A, right panel), 25 μm (B), and 1.5 μm (C).
Figure 8
Figure 8
CALEB/NGC increases density and complexity of dendritic spines and filopodia in mouse cortex. (A) E14.5 mouse embryos were electroporated in utero with pCLEG vector (control) and the indicated constructs. Brain sections of electroporated animals were analyzed after fixation at postnatal day 14 (P14) and staining for GFP for better visualization of spine and filopodia morphology. Representative micrographs of dendritic spines and filopodia are given for each electroporated construct. (B) Quantification of spine and filopodia length in neurons electroporated as described above; 500 (for constructs mCALEBb, CAL1sh, and CAL3sh) and 660 (for pCLEG vector and construct ‘396') spines and filopodia ⩽4.5 μm of 12 neurons were examined for each construct; ***P<0.0005). (C) Quantification of spine and filopodia density; 650 spines and filopodia of 12 neurons were counted for each construct, ***P<0.001, **P<0.01. (D) Quantification of spine and filopodia branch density; 650 spines and filopodia of 12 neurons were analyzed, **P<0.01, *P<0.05. Scale bar, 2.5 μm.
Figure 9
Figure 9
The EGF-like domain of CALEB/NGC drives spine and filopodia morphogenesis independent of PI3K but dependent on PKC. (A) DIV12 hippocampal neurons were co-transfected with the indicated constructs (Figure 3A) and spine morphology was analyzed 3 days later after staining for GFP (co-staining for GFP and FLAG epitope in case of CALEB/NGC-derived constructs). Representative micrographs of dendritic spines and filopodia are given for each transfected construct. (B–D) Quantifications of spine and filopodia length, density and branch density of neurons transfected as described in (A); 1000 spines and filopodia ⩽4.5 μm of 12 neurons were analyzed for each construct, ***P<0.0005, *P<0.05. (E) Representative pictures of spines and filopodia of hippocampal neurons co-transfected at DIV12 with the indicated constructs and treated for 3 days with 20 μM LY294002, which were added 3 h after transfection. (F) Quantification of spine and filopodia length of neurons transfected as described in (E); 719 (without inhibitor) and 1265 (with inhibitor) spines and filopodia ⩽4.5 μm of 12 neurons were analyzed for each construct, ***P<0.0005. (G) Quantification of spine and filopodia length of neurons transfected with constructs encoding EGFP or mCALEBb at DIV12, treated with LY294002 as described above and examined 3 days later after staining for GFP or FLAG epitope; 3000 spines and filopodia ⩽4.5 μm of 36 neurons were analyzed for each construct, ***P<0.001. (H) Representative pictures of spines and filopodia of hippocampal neurons co-transfected at DIV12 with the indicated constructs and treated for 3 days with 10 μM hypericin which were added 3 h after transfection. (I) Quantification of spine and filopodia length of neurons transfected as described in (H); 1350 spines and filopodia ⩽4.5 μm of 12 neurons were analyzed for each construct, ***P<0.0001. Scale bar, 1.5 μm.

Similar articles

Cited by

References

    1. Aono S, Keino H, Ono T, Yasuda Y, Tokita Y, Matsui F, Taniguchi M, Sonta S, Oohira A (2000) Genomic organization and expression pattern of mouse Neuroglycan C in the cerebellar development. J Biol Chem 275: 337–342 - PubMed
    1. Atwal JK, Massie B, Miller FD, Kaplan DR (2000) The TrkB-Shc site signals neuronal survival and local axon growth via MEK and PI3-kinase. Neuron 27: 265–277 - PubMed
    1. Banker G, Goslin K (eds). (1998) Culturing Nerve Cells. Cambridge, MA: MIT Press
    1. Brewer GJ, Torricelli JR, Evege EK, Price PJ (1993) Optimized survival of hippocampal neurons in B27-supplemented neurobasal, a new serumfree medium combination. J Neurosci Res 35: 567–576 - PubMed
    1. Brummelkamp TR, Bernards R, Agami R (2002) A system for stable expression of short interfering RNAs in mammalian cells. Science 296: 550–553 - PubMed

Publication types

MeSH terms