. 2007 May 15;143A(10):1060-70.
doi: 10.1002/ajmg.a.31721.

Differential effects of trisomy on brain shape and volume in related aneuploid mouse models

Affiliations

Differential effects of trisomy on brain shape and volume in related aneuploid mouse models

Kristina Aldridge et al. Am J Med Genet A. .

Abstract

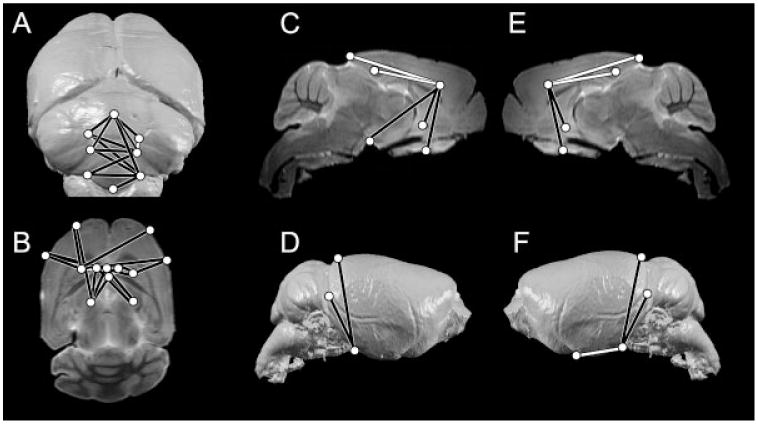
Down syndrome (DS) results from inheritance of three copies of human chromosome 21 (Hsa21). Individuals with DS have a significantly smaller brain size overall and a disproportionately small cerebellum. The small cerebellum is seen in Ts65Dn mice, which have segmental trisomy for orthologs of about half the genes on Hsa21 and provide a genetic model for DS. While small cerebellar size is well-established in mouse and humans, much less is known about the shape of the brain in trisomy. Here we conduct a morphometric analysis of the whole brain and cerebellum in Ts65Dn mice and show that the differences with euploid littermates are largely a function of volume and not of shape. This is not the case in two aneuploid mouse models that have fewer genes orthologous to Hsa21 than Ts65Dn. Ts1Rhr is trisomic for genes corresponding to the so-called Down syndrome critical region (DSCR), which was purported to contain a dosage sensitive gene or genes responsible for many phenotypes of DS. Ms1Rhr is monosomic for the same segment. These models show effects on cerebellum and overall brain that are different from each other and from Ts65Dn. These models can help to identify the contributions of genes from different regions of the chromosome on this and other aspects of brain development in trisomy.


Figures

Fig. 1
Fig. 1
Representation of the segment of genes at dosage imbalance in human trisomy 21 (Down syndrome), and in three aneuploid mouse models: Ts65Dn, Ts1Rhr, and Ms1Rhr. The horizontally stippled segment corresponds with the Down syndrome critical region (DSCR). Gene number represents number of conserved Hsa21-Mmu16 genes (Gardiner et al., 2003).
Fig. 2
Fig. 2
Three-dimensional landmarks collected from each mouse brain HR-MRI, illustrated on representative 3D surface reconstructions and slice images. Landmark placement in figure is approximate and may be slightly offset from the true location for clarity of presentation (see Table 1 for anatomical definition of landmark placement). Numbers are keyed to landmarks definitions in Table 1. A: Caudal surface 3D reconstruction. B: Transverse slice. C: Near mid-sagittal slice, right side. (Landmarks 17, 19 are located lateral to this plane; 5, 24, 27, 28, 29 are located medial to this plane, but are illustrated here to show their relative location on the sagittal plane.) D: Right lateral surface 3D reconstruction. (Landmarks 23, 29 are located deep to the surface, but are shown on this view for clarity of presentation.)
Fig. 3
Fig. 3
LDs that are significantly different by non-parametric confidence interval testing (0.95 ≤ α ≥ 1.05) in Ts65Dn aneuploid mice as compared to euploid littermates illustrated on representative 3D surface reconstructions and slice HR-MR images of a euploid mouse brain. White lines indicate LDs that are significantly increased in Ts65Dn aneuploid mice; black lines are significantly reduced. A: Caudal surface 3D reconstruction. B: Transverse slice. C: Parasagittal slice taken through the brain right of the midline. D: Right lateral surface 3D reconstruction. E: Parasagittal slice taken through the brain left of the midline. F: Left lateral surface 3D reconstruction. Landmarks are defined in Table II. Landmark placement is not exact on these diagrams so as to make all landmarks visible.
Fig. 4
Fig. 4
LDs that are statistically significantly different by non parametric confidence interval testing (0.95 ≤ α ≥ 1.05) in Ts1Rhr aneuploid mice as compared to euploid littermates illustrated on representative 3D surface reconstructions and slice HR-MR images of a euploid mouse brain. White lines indicate LDs that are significantly increased in Ts1Rhr aneuploid mice; black lines are significantly reduced. A: Caudal surface 3D reconstruction. B: Transverse slice. C: Parasagittal slice taken through the brain right of the midline. D: Right lateral surface 3D reconstruction. E: Parasagittal slice taken through the brain left of the midline. F: Left lateral surface 3D reconstruction. Landmarks are defined in Table 1. Landmark placement is not exact in order to make all landmarks visible.
Fig. 5
Fig. 5
LDs that are significantly different by non-parametric confidence interval testing (0.95 ≤ α ≥ 1.05) in Ms1Rhr aneuploid mice as compared to euploid mice illustrated on representative 3D surface reconstructions and slice HR-MR images of a euploid mouse brain. White lines indicate LDs that are significantly increased in the Ms1Rhr mice; black lines are significantly reduced. A: Caudal surface 3D reconstruction. B: Transverse slice. C: Parasagittal slice taken through the brain right of the midline. D: Right lateral surface 3D reconstruction. E: Parasagittal slice taken through the brain left of the midline. F: Left lateral surface 3D reconstruction. Landmarks are defined in Table 1. Landmark placement is not exact in order to make all landmarks visible.

Similar articles

Cited by

References

    1. Abrous D, Koehl M, LeMoal M. Adult neurogenesis: From precursors to network and physiology. Physiol Rev. 2005;85:523–569. - PubMed
    1. Aldridge K, Marsh JL, Govier D, Richtsmeier JT. Central nervous system phenotypes in craniosynostosis. J Anat. 2002;201:31–39. - PMC - PubMed
    1. Arnell H, Gustafsson J, Ivarsson S, Anneren G. Growth and pubertal development in Down syndrome. Acta Paediatr. 1996;85:1102–1106. - PubMed
    1. Aylward E, Habbak R, Warren A, Pulsifer M, Barta P, Jerram M, Pearlson G. Cerebellar volume in adults with Down syndrome. Arch Neurol. 1997;54:209–212. - PubMed
    1. Baxter L, Moran T, Richtsmeier J, Troncoso J, Reeves R. Discovery and genetic localization of Down syndrome cerebellar phenotypes using the Ts65Dn mouse. Hum Mol Genet. 2000;9:195–202. - PubMed

Publication types