. 2007 Apr 13;3(4):e64.
doi: 10.1371/journal.pcbi.0030064. Epub 2007 Feb 21.

Cell size at S phase initiation: an emergent property of the G1/S network

Affiliations

Cell size at S phase initiation: an emergent property of the G1/S network

Matteo Barberis et al. PLoS Comput Biol. .

Abstract

The eukaryotic cell cycle is the repeated sequence of events that enable the division of a cell into two daughter cells. It is divided into four phases: G1, S, G2, and M. Passage through the cell cycle is strictly regulated by a molecular interaction network, which involves the periodic synthesis and destruction of cyclins that bind and activate cyclin-dependent kinases that are present in nonlimiting amounts. Cyclin-dependent kinase inhibitors contribute to cell cycle control. Budding yeast is an established model organism for cell cycle studies, and several mathematical models have been proposed for its cell cycle. An area of major relevance in cell cycle control is the G1 to S transition. In any given growth condition, it is characterized by the requirement of a specific, critical cell size, PS, to enter S phase. The molecular basis of this control is still under discussion. The authors report a mathematical model of the G1 to S network that newly takes into account nucleo/cytoplasmic localization, the role of the cyclin-dependent kinase Sic1 in facilitating nuclear import of its cognate Cdk1-Clb5, Whi5 control, and carbon source regulation of Sic1 and Sic1-containing complexes. The model was implemented by a set of ordinary differential equations that describe the temporal change of the concentration of the involved proteins and protein complexes. The model was tested by simulation in several genetic and nutritional setups and was found to be neatly consistent with experimental data. To estimate PS, the authors developed a hybrid model including a probabilistic component for firing of DNA replication origins. Sensitivity analysis of PS provides a novel relevant conclusion: PS is an emergent property of the G1 to S network that strongly depends on growth rate.


Conflict of interest statement

Competing interests. The authors have declared that no competing interests exist.

Figures

Figure 1
Figure 1. Main Events That Occur during the Yeast Cell Cycle
(A) General representation of the cell cycle showing the discontinuous events that have to take place only once per cell cycle, namely the S phase and the M phase, spaced with G1 and G2 phases that allow increase of the cell size before DNA replication and cell division, respectively. (B) During the dynamics of the cell cycle, RNA and proteins increase exponentially, while the DNA content show a typical doubling amount until the cell divides to generate a newborn daughter. From G1 to M phases, the cell increases continuously in mass. (C) Typical representation of the cell cycle that points out the coordination of the increase in cell mass with DNA replication and cell division in order to maintain size homeostasis. DNA replication and cell division start only when cells have reached a critical cell size (PS and PM, respectively). (D) General representation of the molecular threshold. It involves two molecules, an activator and an inhibitor. When the activator increases with growth, the threshold is overcome when enough molecules of the activator are made to exceed the inhibitor.
Figure 2
Figure 2. Processes Regulating the G1/S Transition in Yeast Cell Cycle
The model comprises transcription of genes coding for cyclins (reactions 1–2), mRNA translation for cyclins, Cdk1, and Ckis (3–9), degradation of mRNA (10–11) and proteins (12–23), reversible or irreversible formation of binary (24–29) and ternary (30–34) protein complexes, Cln3-independent formation of SBF/MBF (35), phosphorylation of protein complexes (36–38), and dissociation of phosphorylated protein complexes (39–41) followed by degradation of the phosphorylated protein. Transport of proteins and protein complexes occurs from cytoplasm to nucleus (42–48) and vice versa (49–53).
Figure 3
Figure 3. Simulated Time Courses for Protein and Protein Complex Concentrations
T1 and T2 represent the threshold-overcome times. In early G1, cytoplasmic Far1, Cln3, and Cdk1 are imported into the nucleus. (A) Nuclear Cdk1-Cln3-Far1 complex reaches its maximal value after 30 min and becomes degraded upon overcoming the Cln3/Far1 threshold (T 1). Then, Cdk1-Cln3 accrues in the nucleus. (B) At about 50 min the accumulation of active SBF/MBF reaches its half-maximal value. (C) Cln and Clb cyclins are produced in substantial amounts. (D) Cdk1-Cln1,2 is accumulated both in cytoplasm and nucleus. (E–F) Cdk1-Clb5,6 accumulates preferentially in the nucleus. (F) The half-maximal value of nuclear Cdk1-Clb5,6 is reached at around 80 min, thereby setting the value of the second threshold (T2).
Figure 4
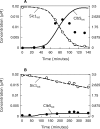
Figure 4. Comparison of Experimental Data and Simulation Results for Total Sic1 and Clb5
Experimental protein levels, indicated as white (Sic1) and black (Clb5) dots, were determined for elutriated wild-type cells grown in glucose medium (A) or ethanol medium (B). For further explanation, see text.
Figure 5
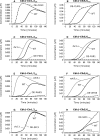
Figure 5. Model Predictions of Gene Dosage Effect
The effects on Cdk1-Cln1,2cyt (left panels) and Cdk1-Clb5,6nuc levels (right panels) are compared with wild-type cells. In each panel, wild-type is shown in black, deletion mutants in gray, and overexpressed strains as a dotted line. (A,B) CLN3 overexpression (OE-CLN3). (C,D) FAR1 deletion (far1Δ) and overexpression (OE-FAR1). (E,F) WHI5 deletion (whi5Δ) and overexpression (OE-WHI5). (G,H) SIC1 deletion (sic1Δ) and overexpression (OE-SIC1).
Figure 6
Figure 6. Effect of Signaling Pathway Activation on Cell Cycle Progression
The effects of the pheromone pathway (A,B) and the stress-response Hog1-dependent pathway (C,D) on Cdk1-Cln1,2cyt (left panels) and Cdk1-Clb5,6nuc (right panels) are reported. In each panel, basal wild-type is shown in black and “activated pathways” as a dotted line.
Figure 7
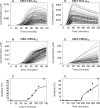
Figure 7. Population Effects on Budding Onset in Yeast Populations Grown in Glucose or in Ethanol
To mimic differences in individual cells in a population, all parameter values are drawn from a normal distribution having the values of the ODE model as mean value. (A,D) A series of individual realizations is shown for Cdk1-Cln1,2cyt. The white curves represent the realizations for the original parameters. (B,E) Individual realizations for Cdk1-Clb5,6nuc. (C,F) Cumulative number (in %) of budded cells as a function of simulation time determined from the realizations presented in (A) and (D) (see Materials and Methods for details on calculation on budding time). Black dots refer to the experimental budding points determined for elutriated wild-type cells.
Figure 8
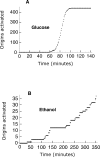
Figure 8. Regulation of Firing of DNA Replication Origins
Cumulative number of fired origins during the course of cell cycle was calculated based on the probabilistic model for firing of origins, as explained in Materials and Methods. (A) Cells grown in glucose. (B) Cells grown in ethanol. Note different scales on the y-axis.
Figure 9
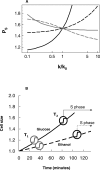
Figure 9. Regulation of the Critical Cell Size PS Necessary To Undergo G1/S Transition
(A) Sensitivity analysis of PS. For each curve, an individual parameter has been varied from 0.1-fold to 10-fold. Black line: growth rate (k growth, k 1, k 2 concomitantly); black dashed line: initial concentration of Far1 (far1cyt[0]); gray dashed line: initial concentration of Cln3 (cln3cyt[0]); gray line: binding value of Sic1 to the Cdk1-Clb5,6 complex (k 32). (B) Simulation of the G1/S transition in elutriated cells indicates how the setting of PS is achieved. Cells start at a volume of 1 and grow with different kinetics in glucose (solid line) and ethanol (dotted line). Overcoming of the first and second threshold, as identified by simulation, is shown by circled symbols (gray, first threshold; black, second threshold).
Figure 10
Figure 10. Control of Cell Size by Far1 Acts through Cln3
Protein content (P; [i.e., the average protein content determined using flow cytometry of FITC-stained cells]), doubling time (T), and length of the budded phase (Tb) for wild-type (black bar, control; white bar, FAR1 overexpression) and cln3Δ strain (dashed bar, normal; checkered bar, FAR1 overexpression). Protein content is expressed as arbitrary units (i.e., channel number determined from FACS analysis), T and Tb in minutes.

References

    1. Mitchison JM. The biology of the cell cycle. Cambridge: Cambridge University Press; 1971. 320
    1. Wells WA. Does size matter? J Cell Biol. 2002;158:1156–1159. - PMC - PubMed
    1. Jorgensen P, Tyers M. How cells coordinate growth and division. Curr Biol. 2004;14:R1014–R1027. - PubMed
    1. Grebien F, Dolznig H, Beug H, Mullner EW. Cell size control: New evidence for a general mechanism. Cell Cycle. 2005;4:418–421. - PubMed
    1. Nurse P. Genetic control of cell size at cell division in yeast. Nature. 1975;256:547–551. - PubMed

Publication types

MeSH terms

Substances