. 2007 Apr 13;3(4):e68.
doi: 10.1371/journal.pcbi.0030068. Epub 2007 Feb 27.

Synchronization-induced rhythmicity of circadian oscillators in the suprachiasmatic nucleus

Affiliations

Synchronization-induced rhythmicity of circadian oscillators in the suprachiasmatic nucleus

Samuel Bernard et al. PLoS Comput Biol. .

Abstract

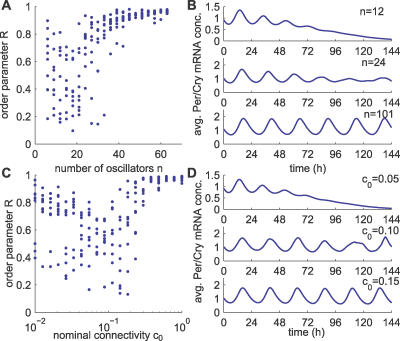
The suprachiasmatic nuclei (SCN) host a robust, self-sustained circadian pacemaker that coordinates physiological rhythms with the daily changes in the environment. Neuronal clocks within the SCN form a heterogeneous network that must synchronize to maintain timekeeping activity. Coherent circadian output of the SCN tissue is established by intercellular signaling factors, such as vasointestinal polypeptide. It was recently shown that besides coordinating cells, the synchronization factors play a crucial role in the sustenance of intrinsic cellular rhythmicity. Disruption of intercellular signaling abolishes sustained rhythmicity in a majority of neurons and desynchronizes the remaining rhythmic neurons. Based on these observations, the authors propose a model for the synchronization of circadian oscillators that combines intracellular and intercellular dynamics at the single-cell level. The model is a heterogeneous network of circadian neuronal oscillators where individual oscillators are damped rather than self-sustained. The authors simulated different experimental conditions and found that: (1) in normal, constant conditions, coupled circadian oscillators quickly synchronize and produce a coherent output; (2) in large populations, such oscillators either synchronize or gradually lose rhythmicity, but do not run out of phase, demonstrating that rhythmicity and synchrony are codependent; (3) the number of oscillators and connectivity are important for these synchronization properties; (4) slow oscillators have a higher impact on the period in mixed populations; and (5) coupled circadian oscillators can be efficiently entrained by light-dark cycles. Based on these results, it is predicted that: (1) a majority of SCN neurons needs periodic synchronization signal to be rhythmic; (2) a small number of neurons or a low connectivity results in desynchrony; and (3) amplitudes and phases of neurons are negatively correlated. The authors conclude that to understand the orchestration of timekeeping in the SCN, intracellular circadian clocks cannot be isolated from their intercellular communication components.


Conflict of interest statement

Competing interests. The authors have declared that there are no competing interests.

Figures

Figure 1
Figure 1. Scheme of the Single-Cell Circadian Oscillator, Including the Coupling Mechanism
The intracellular oscillator consists of interlocked positive and negative transcriptional/translational feedback loops. In the negative feedback loop, Per and Cry genes (treated as a single variable) inhibit their own transcription by preventing BMAL1 from promoting Per/Cry transcription. In the positive feedback loop, the PER/CRY complex activates the transcription of their common transcriptional activator, Bmal1 [23]. We assumed that the release of the neurotransmitter in the extracellular medium is activated by PER/CRY. In turn, the neurotransmitter activates a signaling cascade (involving PKA and CREB) that activates Per/Cry expression. In this schematic representation, solid arrows denote transport, translation steps, or phosphorylation/dephosphorylation reactions, while dashed arrows denote transcriptional regulations. The stars indicate the active (phosphorylated or complexed) form of the proteins. For a full reasoning of modeling assumptions see main text and [23].
Figure 2
Figure 2. Organization of the Circadian Oscillator Networks
(A) Random coupling (type 1). The probability that two oscillators are connected is independent of their positions. (B) Nearest-neighbor coupling (type 2). Oscillators are on a grid with a Euclidian distance d. Circle representing oscillators are color-coded for their distance from the central black oscillator. Black, red, orange, blue, gray, and white circles are at distances d = 0, 1,formula image , 2,formula image , and 2formula image 
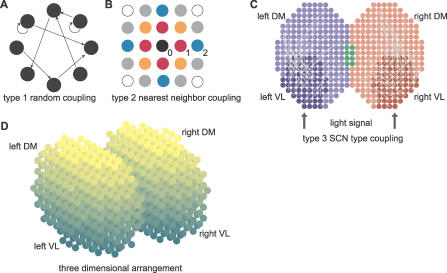
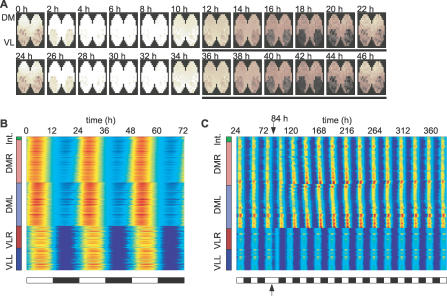
, respectively. Two oscillators are connected if their distance is less than a threshold dmax. (C) SCN-like coupling (type 3). The SCN is divided in four regions, left and right VL regions (dark blue and red, respectively), and left and right DM regions (light blue and red, respectively; the green part is the intersection between left and right DM regions). Each dot represents an oscillator. Projections from the VL regions to their respective DM regions are indicated by light gray arcs. Projections from one cell to another are assigned randomly, with probability 0.5 for a DM cell to receive a projection. (D) Representation of a 3-D SCN. Each dot is a cell, and the color gradient indicates the VL–DM axis (dark cells are on the VL side and light cells are on the DM side, corresponding to the vertical axis in [C]). For type 3 coupling in a 3-D SCN, the regions are defined in the same way as in 2-D (C).
Figure 3
Figure 3. Synchronization of Damped Oscillators
(A) Simulated evolution of Per/Cry mRNA expression over 48 h of 309 coupled neurons in a 2-D SCN slice with a type 2 coupling (nearest-neighbor coupling; dmax = 3.5, K = 0.9). Dark brown corresponds to a low level of Per/Cry expression, while white corresponds to a high expression. (B) Time series of ten randomly chosen oscillators from the slice shown in (A). (C) Time series of ten randomly chosen uncoupled, free-running (dmax = 0, K = 0.9) oscillators. (D) Distribution of cell-intrinsic periods (black, VL neurons; white, DM neurons; total number of cells, n = 309). (E) Time series of ten transiently weakly coupled oscillators (dmax = 3.5, K = 0.3 between t = 84 and 168 h; n = 309). (F) Evolution of ten randomly picked oscillators simulating loss of VPAC2 receptor (f decreasing function of the distance, dmax = 1, K = 0.45, n = 309). The decreasing f (see Equation 15) means that the signal is stronger for autocrine coupling. The thick black lines represent the average output. The resulting period is 24.7 h, and the average period of individual oscillators is 24.6 ± 1.2 h.
Figure 4
Figure 4. Single-Cell Rhythmicity Implies Synchrony
(A–C) Phase space of a network of two oscillators showing possible dynamic behaviors. Each panel represents a condition that was simulated in the previous subsection. The inlets show what kind of coupling was considered (spirals, damped oscillators; solid arrows, normal coupling [K = 0.9]; dashed arrows, weak coupling [K = 0.3]; red and green arrows, paracrine and autocrine coupling, respectively). The axes show the differences of Per/Cry mRNA and PER/CRY complex concentrations between the two oscillators. This way, two oscillators can be represented in a 2-D space. (A) Normal, wild-type condition. The oscillators are normally coupled (autocrine and paracrine coupling), and the result is a regular, clock-like cycle denoting synchrony. (B) Dispersed condition. Oscillators with autocrine activation only are rhythmic, but quickly run out of phase. The result is an irregular cycle as phase differences are not constant. (C) Weak coupling. Oscillators with weak paracrine and autocrine coupling damp out to a steady state. (D) Stable steady state of Per/Cry mRNA under constant input. The minimal and maximal values of rhythmic input signals (variable X 2) under normal coupling conditions are indicated by the dashed lines. (E) Phase space of a single oscillator with constant input. Because the intracellular oscillator is 7-D, we had to reduce the phase space from seven to two dimensions, and we chose a projection plane for which the trajectory was closest to a spiral.
Figure 5
Figure 5. Effect of the Number of Oscillators as Well as the Connectivity on Synchronization
(A) Synchronization properties of randomly coupled networks with respect to the number of neurons n (c 0 = 0.10). Each dot represents the order parameter R for one realization of a random network and a simulation. Ten simulations were performed for each value of cell number n. The total length of the simulations was 312 h after starting with random initial conditions, and the order parameter was calculated over the last 240 h. (B) Three examples of average output for n = 12, 24, and 101. (C) Synchronization properties of randomly coupled networks with respect to the connectivity c 0 (n = 12). Ten simulations were performed for each value of nominal connectivity c 0. Other parameters as in (A). (D) Three examples of average Per/Cry mRNA concentration for c 0 = 0.05, 0.10, and 0.15.
Figure 6
Figure 6. Effect of the Intrinsic Period on Amplitude and Phase
(A) Resulting periods of two mixed populations of oscillators, one with a 24 h period and one with 20 h period (type 1 coupling; c 0 = 0.1). The period was calculated with proportions of 24 h period cells of 0.0, 0.1, 0.2, 0.5, 0.8, and 1.0, and results of five runs for each proportion were averaged (total n = 100, [open circles] average period). The dashed line represents the average of the individual oscillators' periods. (B) Deviation of the resulting population periods shown in (A) from the average of the individual oscillator periods (the error bars are the standard deviations). (C) Three coupled oscillators with different intrinsic periods showing their phase and amplitude relationships: the short period oscillator (thick blue line) is phase-advanced and low amplitude compared with the average period oscillator (green line) and the long period oscillator (dashed red line). (D) Phase difference from the average Per/Cry mRNA concentration with respect to the intrinsic periods, from the simulations shown in Figure 3A and 3B (dark blue ×, left VL neurons; light blue, left DM neurons; dark red ×, right VL neurons; light red, right DM neurons). A positive phase difference means phase-advanced compared with the phase of the population. (E) Amplitude with respect to the intrinsic period from the simulations shown in Figure 3A and 3B (color code as in [D]). (F) Amplitude phase relationship for type 1 coupling (K = 0.9, c 0 = 0.1, number of oscillators n = 100).
Figure 7
Figure 7. Simulation of Entrainment of a 2-D SCN Slice by a 12:12 LD Cycle
(A) Simulation of the evolution of Per/Cry mRNA over 48 h of 309 coupled cells (VL, n = 102; DM, n = 207) in a 2-D SCN slice with a type 3 coupling (dmax = 3.5, 50% of neuronal projections, 4% average period gradient, K = 1.0, L 0 = 0.22). The black bars indicate a dark phase (color code as in Figure 3A). Individual oscillators have an average period of 23.7 ± 1.2 h. Initial conditions were chosen randomly. The first 72 h of transient were discarded, and the time from 72 h to 144 h was retained. (B,C) Raster plot of Per/Cry mRNA activity in oscillators, organized according to their regions (from bottom up: VLL, left VL region; VLR, right VL region; DML, left DM region; DMR, right DM region; and Int, intersection between left and right DM regions). The concentration of Per/Cry mRNA for each oscillator is represented by colors (blue, low concentration; red, high concentration). (B) 12:12 LD cycle. (C) 12:12 LD cycle with a 12 h phase shift at t = 84 h.

References

    1. Reppert SM, Weaver DR. Coordination of circadian timing in mammals. Nature. 2002;418:935–941. - PubMed
    1. Aton SJ, Herzog ED. Come together, right...now: Synchronization of rhythms in a mammalian circadian clock. Neuron. 2005;48:531–534. - PMC - PubMed
    1. Antle MC, Silver R. Orchestrating time: Arrangements of the brain circadian clock. Trends Neurosci. 2005;28:145–151. - PubMed
    1. Welsh DK, Logothetis DE, Meister M, Reppert SM. Individual neurons dissociated from rat suprachiasmatic nucleus express independently phased circadian firing rhythms. Neuron. 1995;14:697–706. - PubMed
    1. Honma S, Nakamura W, Shirakawa T, Honma K. Diversity in the circadian periods of single neurons of the rat suprachiasmatic nucleus depends on nuclear structure and intrinsic period. Neurosci Lett. 2004;358:173–176. - PubMed

Publication types

MeSH terms