

Increasing the power to detect causal associations by combining genotypic and expression data in segregating populations
- PMID: 17432931
- PMCID: PMC1851982
- DOI: 10.1371/journal.pcbi.0030069
Increasing the power to detect causal associations by combining genotypic and expression data in segregating populations
Abstract
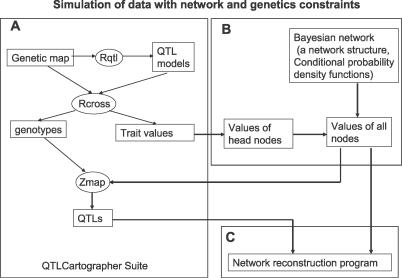
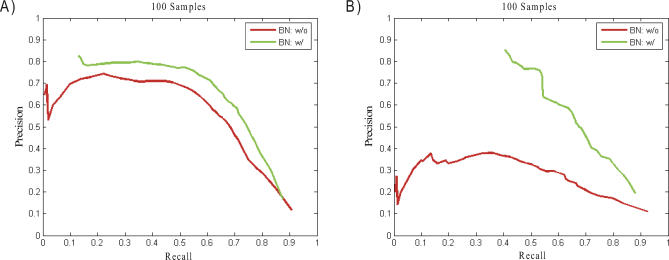
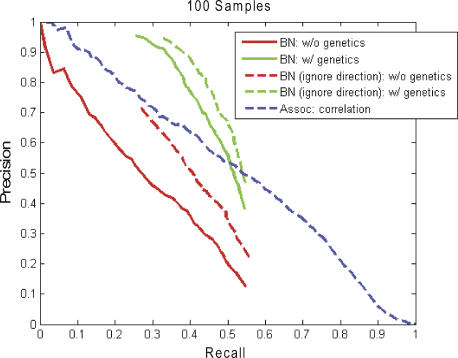
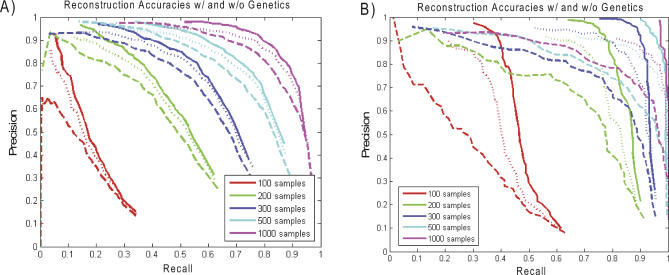
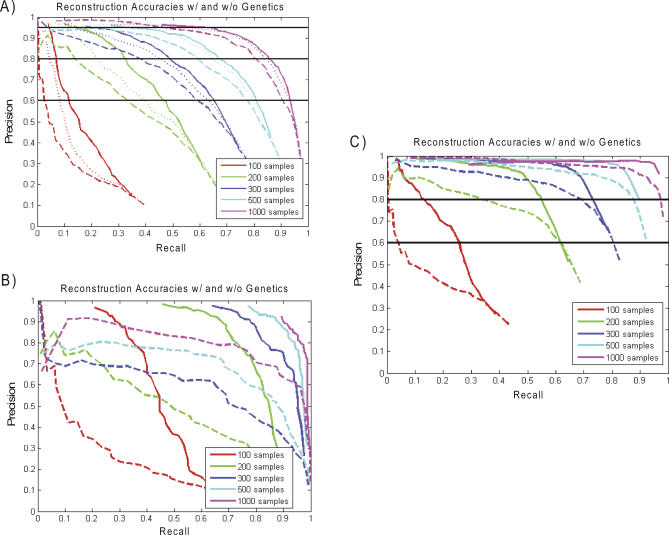
To dissect common human diseases such as obesity and diabetes, a systematic approach is needed to study how genes interact with one another, and with genetic and environmental factors, to determine clinical end points or disease phenotypes. Bayesian networks provide a convenient framework for extracting relationships from noisy data and are frequently applied to large-scale data to derive causal relationships among variables of interest. Given the complexity of molecular networks underlying common human disease traits, and the fact that biological networks can change depending on environmental conditions and genetic factors, large datasets, generally involving multiple perturbations (experiments), are required to reconstruct and reliably extract information from these networks. With limited resources, the balance of coverage of multiple perturbations and multiple subjects in a single perturbation needs to be considered in the experimental design. Increasing the number of experiments, or the number of subjects in an experiment, is an expensive and time-consuming way to improve network reconstruction. Integrating multiple types of data from existing subjects might be more efficient. For example, it has recently been demonstrated that combining genotypic and gene expression data in a segregating population leads to improved network reconstruction, which in turn may lead to better predictions of the effects of experimental perturbations on any given gene. Here we simulate data based on networks reconstructed from biological data collected in a segregating mouse population and quantify the improvement in network reconstruction achieved using genotypic and gene expression data, compared with reconstruction using gene expression data alone. We demonstrate that networks reconstructed using the combined genotypic and gene expression data achieve a level of reconstruction accuracy that exceeds networks reconstructed from expression data alone, and that fewer subjects may be required to achieve this superior reconstruction accuracy. We conclude that this integrative genomics approach to reconstructing networks not only leads to more predictive network models, but also may save time and money by decreasing the amount of data that must be generated under any given condition of interest to construct predictive network models.
Conflict of interest statement
Figures
References
-
- Pearl J. Probabilistic reasoning in intelligent systems: Networks of plausible inference. San Mateo (California): Morgan Kaufmann Publishers. p. xix; 1988. 552
-
- Pe'er D, Regev A, Elidan G, Friedman N. Inferring subnetworks from perturbed expression profiles. Bioinformatics. 2001;17(Supplement 1):S215–S224. - PubMed
-
- Sachs K, Perez O, Pe'er D, Lauffenburger DA, Nolan GP. Causal protein-signaling networks derived from multiparameter single-cell data. Science. 2005;308:523–529. - PubMed
-
- Zhu J, Lum PY, Lamb J, GuhaThakurta D, Edwards SW, et al. An integrative genomics approach to the reconstruction of gene networks in segregating populations. Cytogenet Genome Res. 2004;105:363–374. - PubMed
MeSH terms
Substances
LinkOut - more resources
Full Text Sources
Other Literature Sources
