. 2007 Jun;33(6):894-904.
doi: 10.1016/j.ultrasmedbio.2006.12.008. Epub 2007 Apr 16.

Quantification and MRI validation of regional contractile dysfunction in mice post myocardial infarction using high resolution ultrasound

Affiliations

Quantification and MRI validation of regional contractile dysfunction in mice post myocardial infarction using high resolution ultrasound

Yinbo Li et al. Ultrasound Med Biol. 2007 Jun.

Abstract

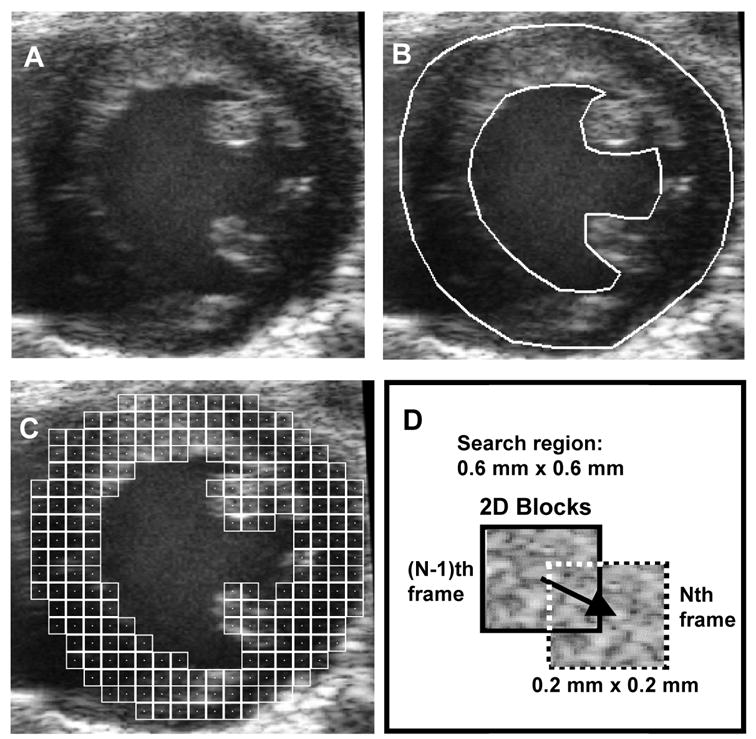
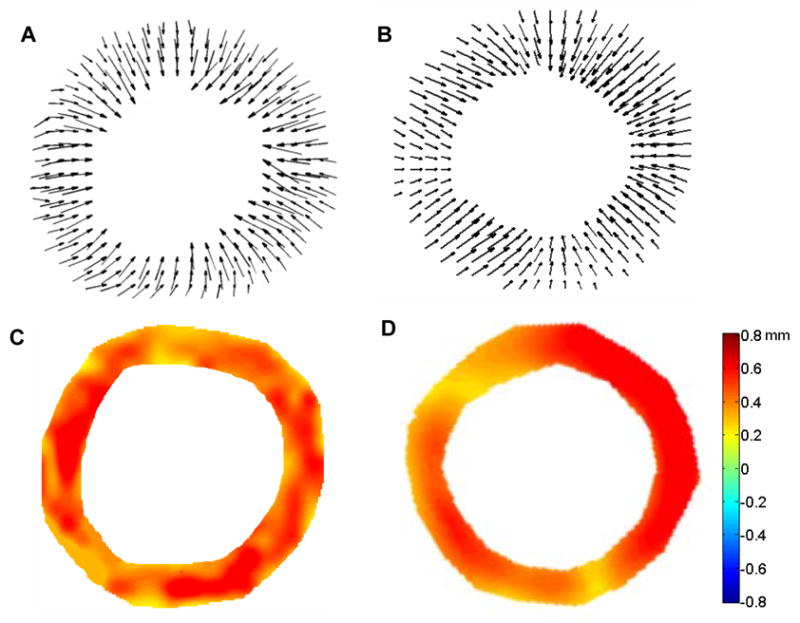
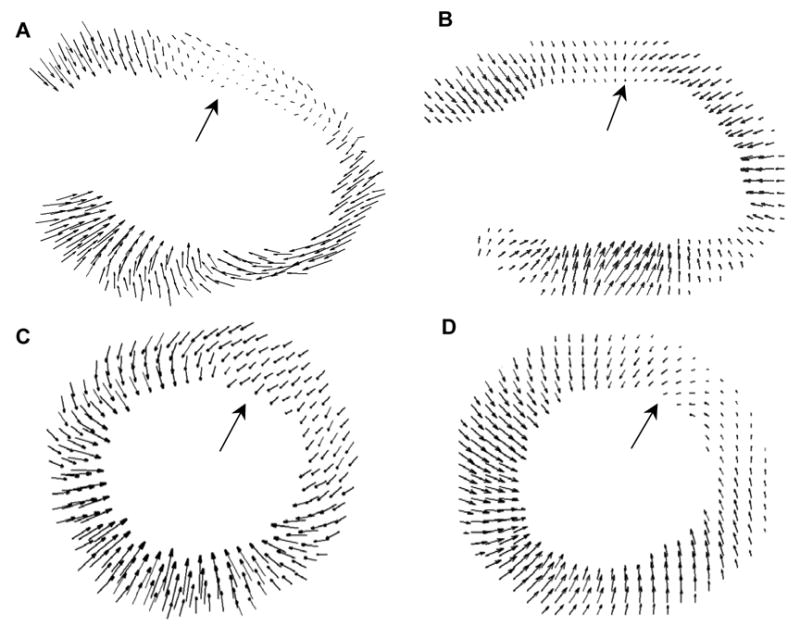
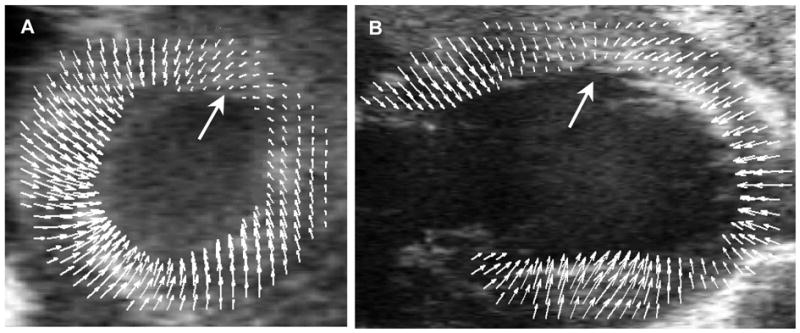
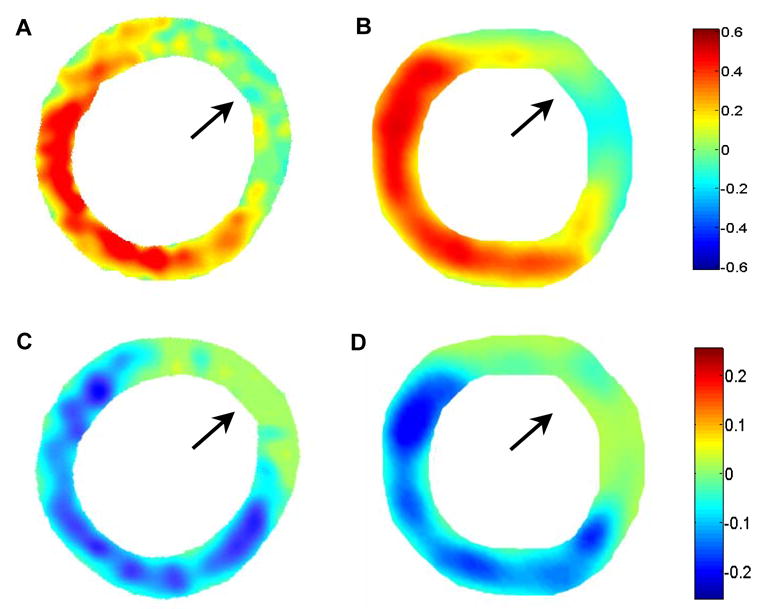
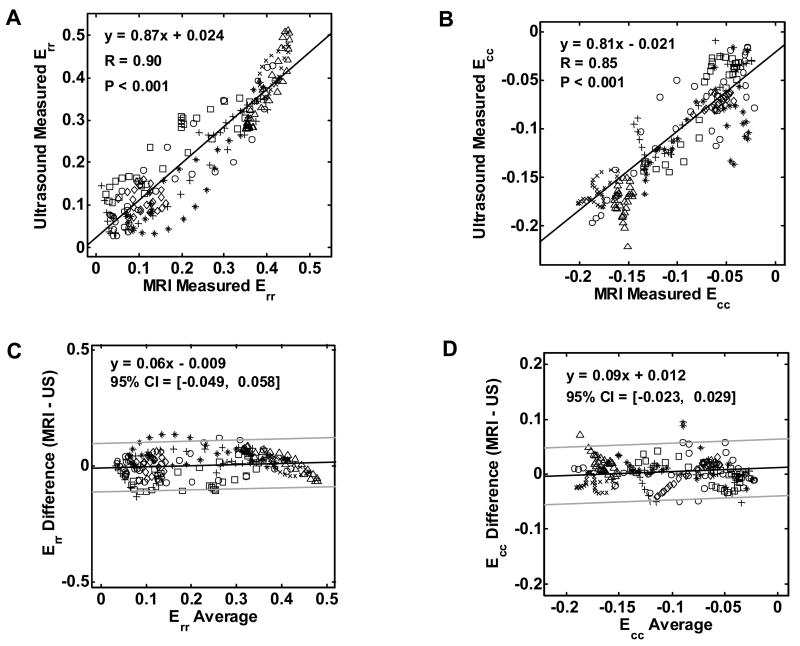
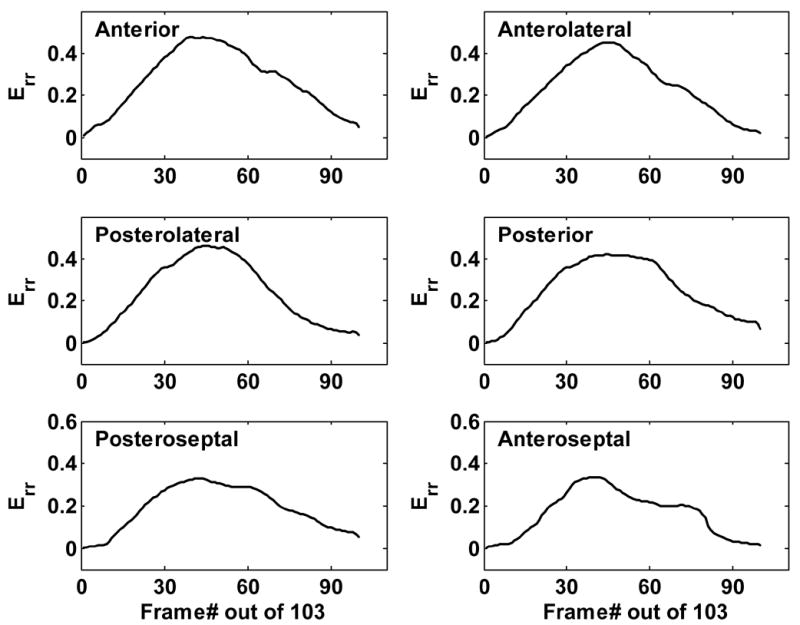
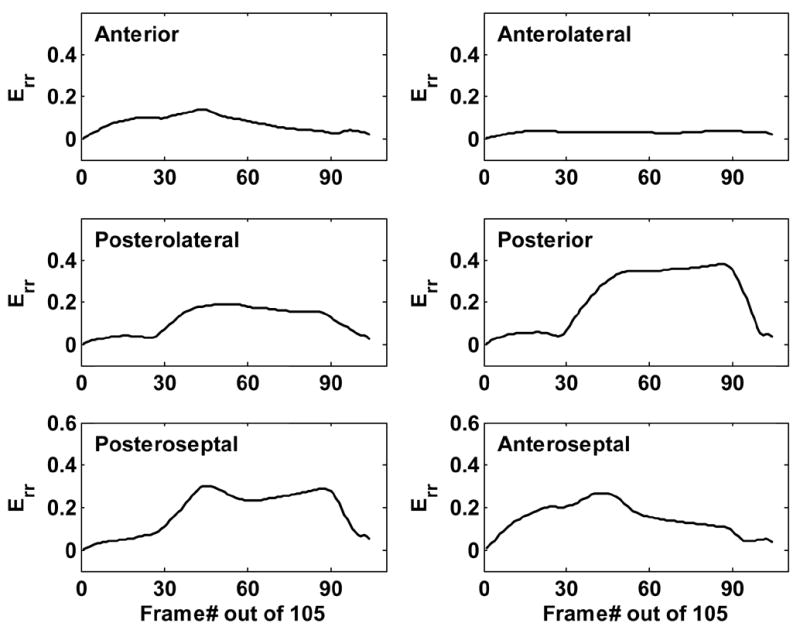
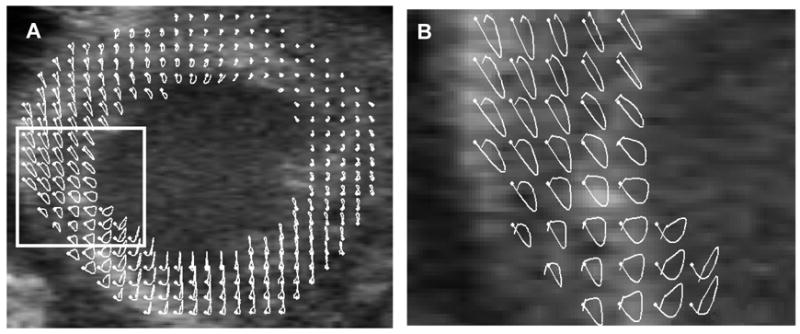
A versatile, computationally efficient two-dimensional (2D) speckle-tracking method based on high resolution ultrasound imaging is proposed to quantify regional myocardial dysfunction in mice. Ultrasound scans were performed on the hearts of normal and post myocardial infarction (MI) mice with a Vevo770 scanner (VisualSonics, Toronto, Canada) operating at 30 MHz frequency. Regional myocardial motion was tracked using a 2D minimum sum of absolute differences (MSAD) block-matching algorithm. Motion analyses calculated from ultrasound images were compared with gold-standard analyses performed using small animal magnetic resonance imaging (MRI). The radial and circumferential components of strain were compared between ultrasound and MRI short axis views and promising correlations were obtained (r = 0.90 and r = 0.85 for radial and circumferential strain, respectively). Therefore, ultrasound imaging, followed by 2D image tracking, provides an effective, low cost, mobile method to quantify murine cardiac function accurately and reliably.


Figures

Fig. 1
Fig. 1
Schematic of the speckle tracking process. A, raw B-mode image. B, identification of ROI (i.e., LV myocardium). C, population of ROI with 2D pixel blocks for tracking displacement. D, schematic of 2D pixel block-matching between two adjacent frames.
Fig. 2
Fig. 2
ED-to-ES displacement vector fields from short-axis views of the mid-ventricle from healthy C57BL/6 mice illustrated in “arrow” representations obtained via MRI (A) and ultrasound (B). ED-to-ES radial displacement maps in color gradient representations obtained via MRI (C) and ultrasound (D). Positive values in the color bar indicate radially inward displacements.
Fig. 3
Fig. 3
ED-to-ES displacement maps for a D1 post-MI mouse heart in long-axis view (top – lateral wall, bottom – septum) using MRI (A) and ultrasound (B); and in the mid-ventricular, short-axis view of another D1 post-MI mouse heart (left – septum, right – lateral wall, top – anterior wall, bottom – posterior wall), using MRI (C) and ultrasound (D). In both the MRI and ultrasound assessments, defects in contraction were evident in the lateral wall in the long-axis view and in the anterolateral segment in the short-axis view (indicated by large arrows)
Fig. 4
Fig. 4
Displacement maps for a D1 post-MI mouse heart superimposed onto the original ultrasound images to provide a visual representation of the relationship between anatomy and function. A, mid-ventricular, short-axis view. B, long-axis view of a second D1 post-MI mouse heart. The orientations of A and B are the same as in Figure 3. Wall motion defects are indicated with large arrows.
Fig. 5
Fig. 5
ED-to-ES Err strain maps from a D1 post-MI mouse heart using MRI (A) and ultrasound (B). ED-to-ES Ecc strain maps from the same mouse heart using MRI (C) and ultrasound (D). The orientation is the same as in the short-axis views shown in Figures 3 and 4. In both the Err and Ecc, maps, defects in contraction are observed in the anterolateral LV (as indicated by arrows).
Fig. 6
Fig. 6
Correlation of strain values as measured by ultrasound and MRI for Err (A) and for Ecc(B). Bland Altman plots for Err (C) and for Ecc (D) indicate the mean differences with dark lines and the 95% confidence intervals (CI) calculated as mean ± 2 SD with light lines. Different markers in the graphs are used to identify individual mice. ‘∆’ and ‘×’ represent the two normal mice; ‘○’, ‘*’,’ □’,’◇’ represent the five post-MI mice.
Fig. 7
Fig. 7
Time evolution of Err throughout a cardiac cycle in six myocardial sectors from a normal mouse heart assessed using ultrasound. Peak Err was 0.45 in the anterolateral wall and 0.38 in the septum, consistent with the results of cardiac MRI.
Fig. 8
Fig. 8
Time evolution of Err throughout a cardiac cycle in six myocardial sectors from a D1 post-MI mouse heart assessed using ultrasound. The magnitude of Err remains relatively unaffected in the posterior and posteroseptal walls, while the infarct region and its border zones exhibit a remarkable decrease in Err.
Fig. 9
Fig. 9
Trajectories of 2D pixel blocks through a complete cardiac cycle. Panel A shows a mid-ventricular, short-axis image of an infarcted mouse heart with superimposed trajectories in white. Panel B shows a magnified view of the region bounded by the rectangle in A. The white dots denote the starting position of the tracked tissue elements at ED.

References

    1. Aboagye EO. Positron emission tomography imaging of small animals in anticancer drug development. Mol Imaging Biol. 2005;7(1):53–8. - PubMed
    1. Acton PD, Kung HF. Small animal imaging with high resolution single photon emission tomography. Nucl Med Biol. 2003;30(8):889–95. - PubMed
    1. Amundsen B, Helle-Valle T, Edvardsen T, et al. Noninvasive myocardial strain measurement by speckle tracking echocardiography: validation against sonomicrometry and tagged magnetic resonance imaging. J Am Coll Cardiol. 2006;47:789–93. - PubMed
    1. Anderson T, Denvir M, Sharif I, et al. High frequency linear array scanner for the imaging of small rodents. IEEE Ultrasonics Symposium. 2003;2:1935– 1937.
    1. Arai A, Gaither Cr, Epstein F, Balaban R, Wolff S. Myocardial velocity gradient imaging by phase contrast MRI with application to regional function in myocardial ischemia. Magn Reson Med. 1999;49(2):98–109. - PubMed

Publication types