. 2007 May 25;146(3):946-61.
doi: 10.1016/j.neuroscience.2007.02.022. Epub 2007 Apr 16.

Effect of tricyclodecan-9-yl potassium xanthate (D609) on phospholipid metabolism and cell death during oxygen-glucose deprivation in PC12 cells

Affiliations

Effect of tricyclodecan-9-yl potassium xanthate (D609) on phospholipid metabolism and cell death during oxygen-glucose deprivation in PC12 cells

E C Larsen et al. Neuroscience. .

Abstract

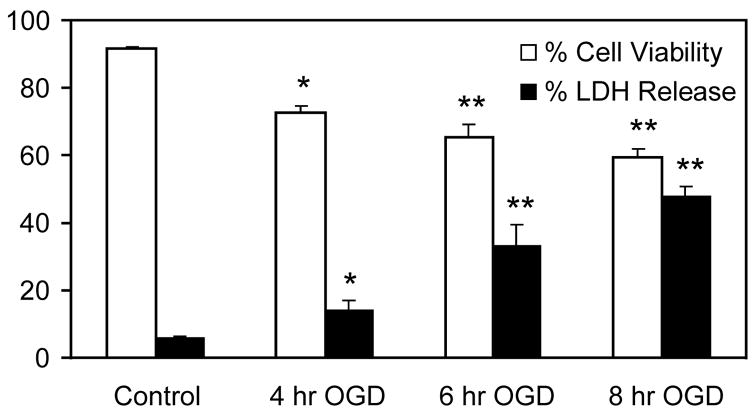
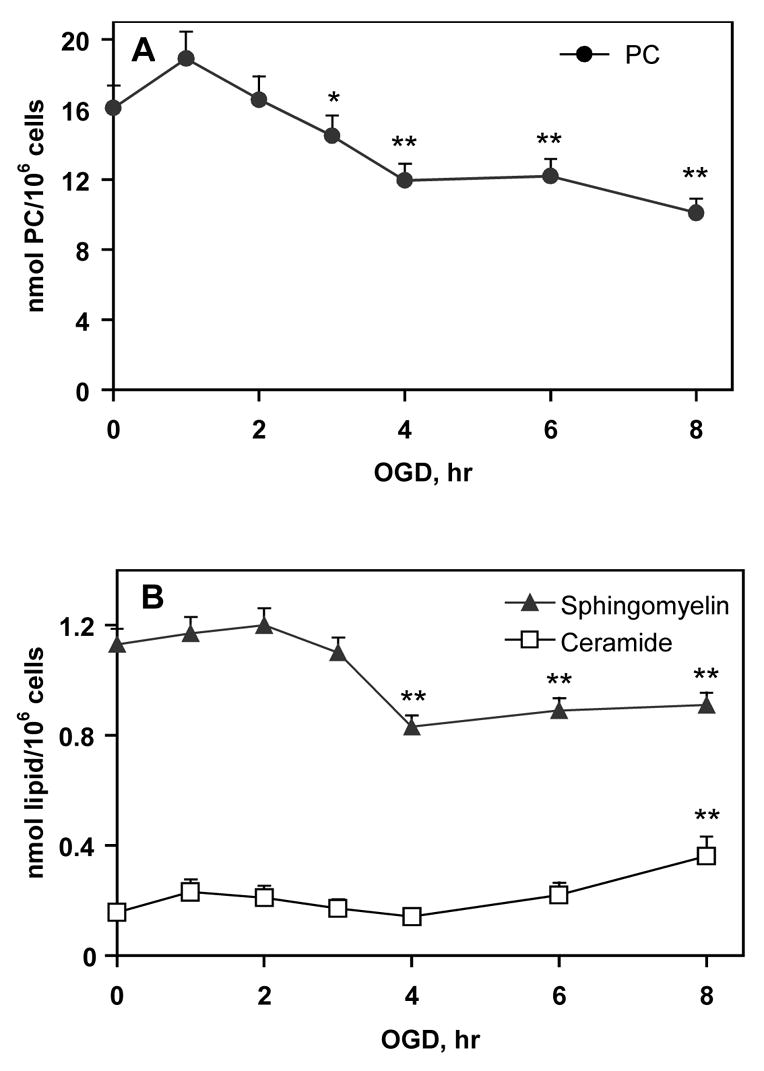
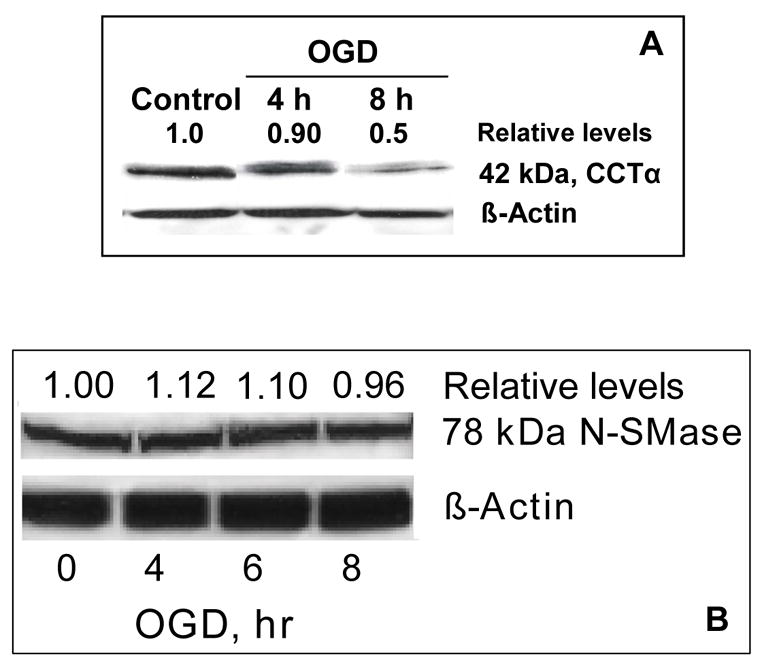
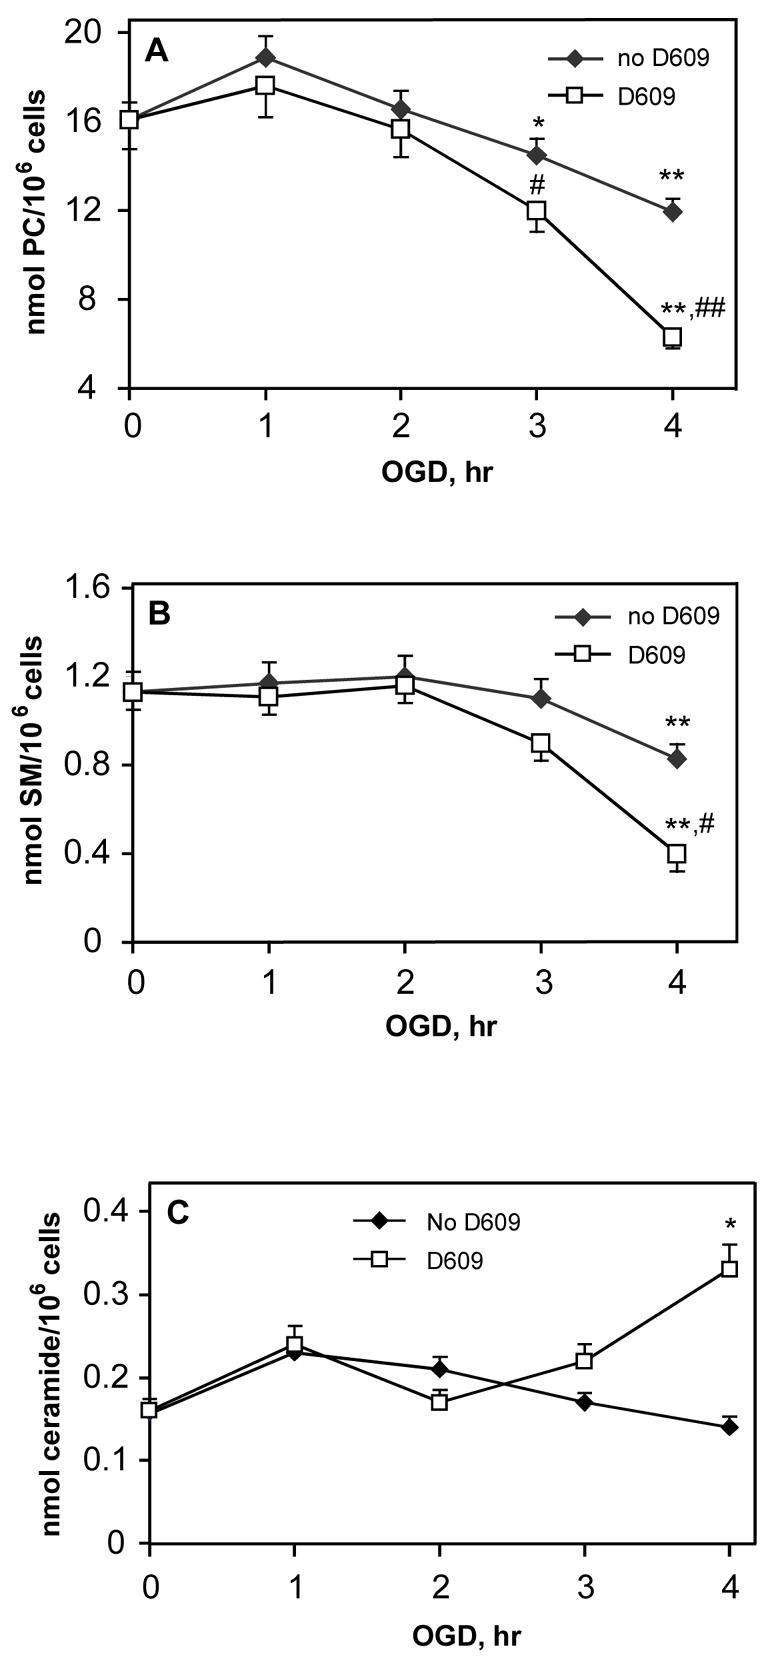
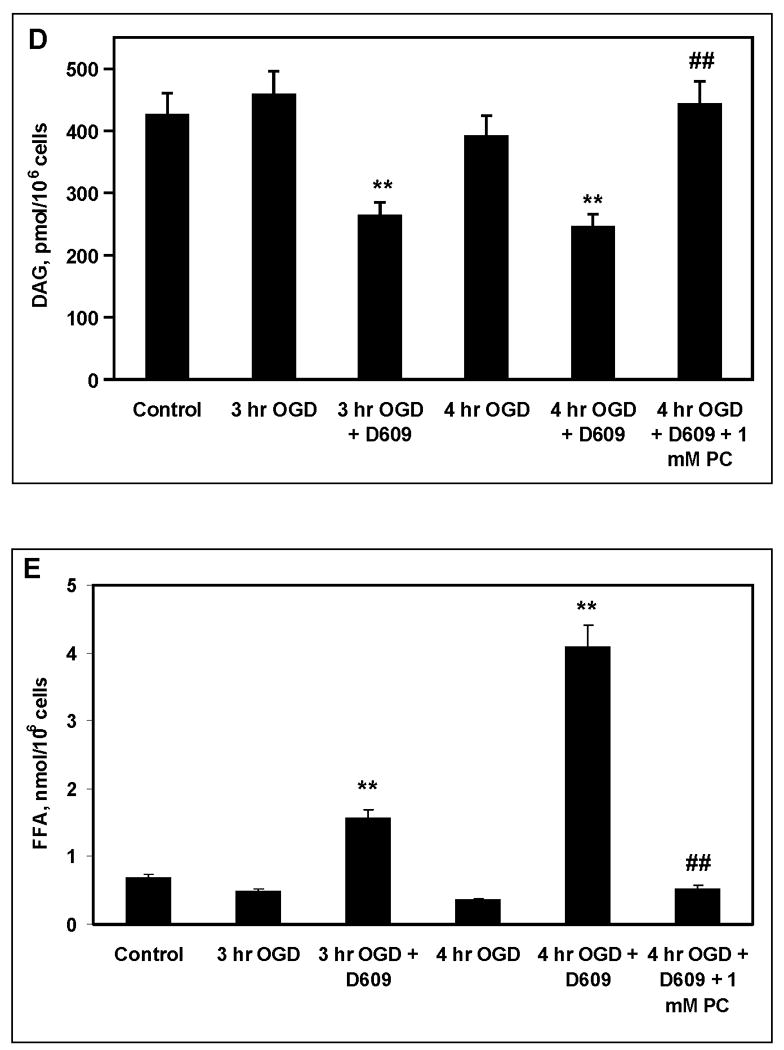
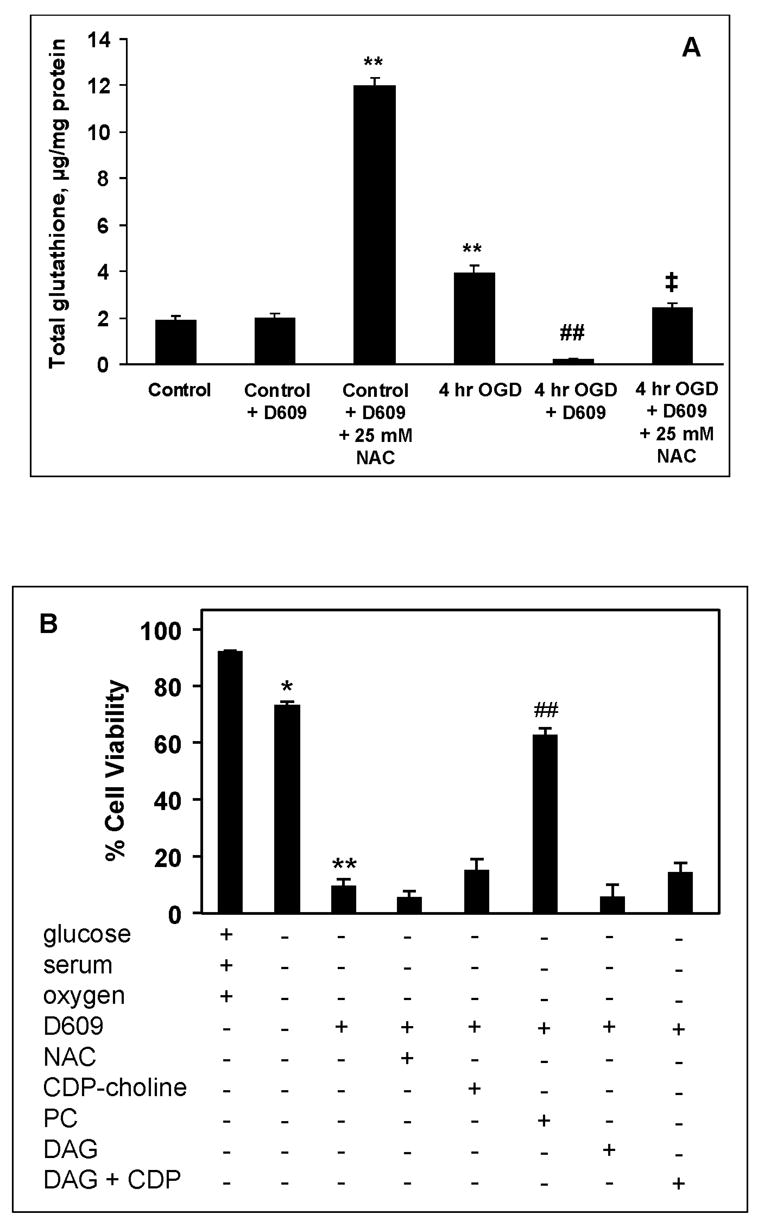
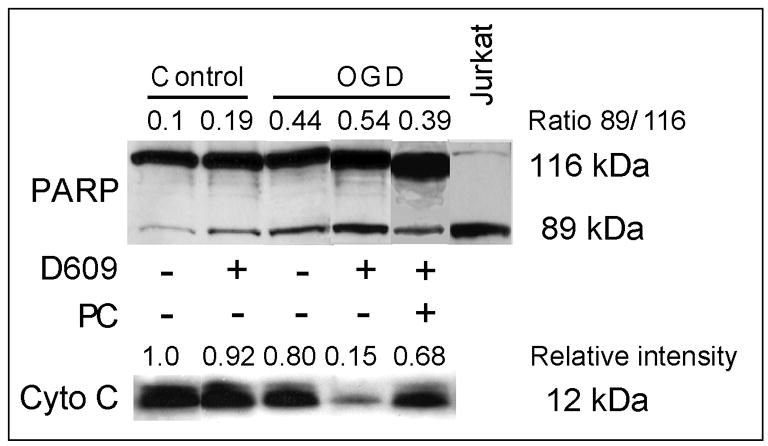
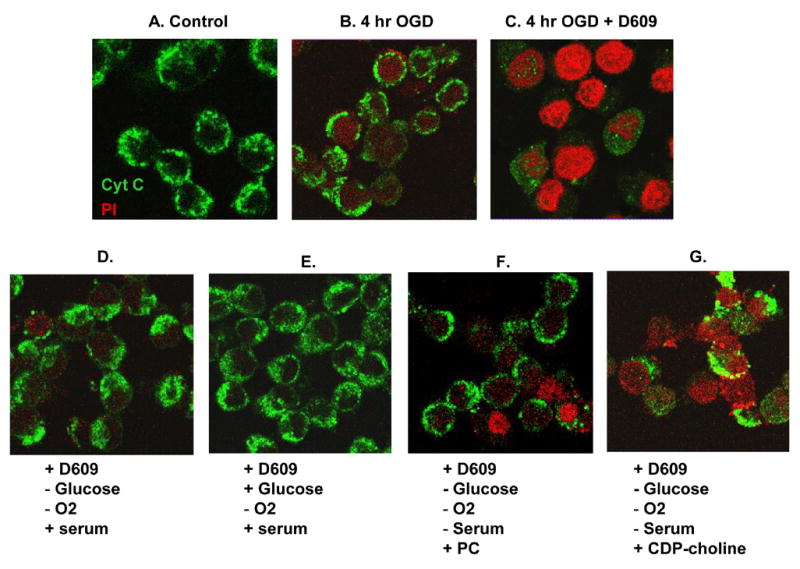
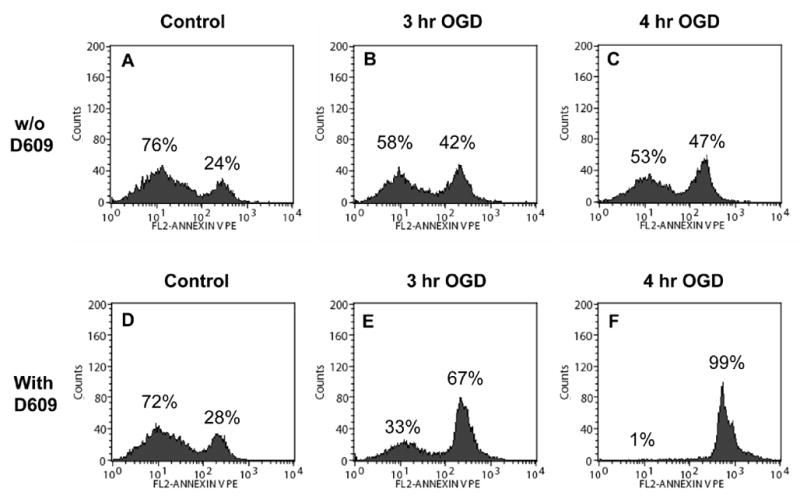
Alterations in lipid metabolism play an integral role in neuronal death in cerebral ischemia. Here we used an in vitro model, oxygen-glucose deprivation (OGD) of rat pheochromocytoma (PC12) cells, and analyzed changes in phosphatidylcholine (PC) and sphingomyelin (SM) metabolism. OGD (4-8 h) of PC12 cells triggered a dramatic reduction in PC and SM levels, and a significant increase in ceramide. OGD also caused increases in phosphatidylcholine-phospholipase C (PC-PLC) and phospholipase D (PLD) activities and PLD2 protein expression, and reduction in cytidine triphosphate:phosphocholine cytidylyltransferase-alpha (CCTalpha, the rate-limiting enzyme in PC synthesis) protein expression and activity. Phospholipase A2 activity and expression were unaltered during OGD. Increased neutral sphingomyelinase activity during OGD could account for SM loss and increased ceramide. Surprisingly, treatment with PC-PLC inhibitor tricyclodecan-9-yl potassium xanthate (D609) aggravated cell death in PC12 cells during OGD. D609 was cytotoxic only during OGD; cell death could be prevented by inclusion of sera, glucose or oxygen. During OGD, D609 caused further loss of PC and SM, depletion of 1,2-diacylglycerol (DAG), increase in ceramide and free fatty acids (FFA), cytochrome c release from mitochondria, increases in intracellular Ca2+ ([Ca2+]i), poly-ADP ribose polymerase (PARP) cleavage and phosphatidylserine externalization, indicative of apoptotic cell death. Exogenous PC during OGD in PC12 cells with D609 attenuated PC, SM loss, restored DAG, attenuated ceramide levels, decreased cytochrome c release, PARP cleavage, annexin V binding, attenuated the increase in [Ca2+]i, FFA release, and significantly increased cell viability. Exogenous PC may have elicited these effects by restoring membrane PC levels. A tentative scheme depicting the mechanism of action of D609 (inhibiting PC-PLC, SM synthase, PC synthesis at the CDP-choline-1,2-diacylglycerol phosphocholine transferase (CPT) step and causing mitochondrial dysfunction) has been proposed based on our observations and literature.


Figures

FIGURE 1
FIGURE 1. Effect of OGD on PC12 cell survival
PC12 cells were subjected to OGD for up to 8-h. Cell viability was determined by trypan blue staining. * p<0.05 and ** p<0.01 vs. control (n=6).
FIGURE 2
FIGURE 2. OGD significantly altered the lipid levels of PC12 cells
Values are given as total fatty acids derived from the respective lipids. (A) PC levels (B) SM and ceramide levels. There were no significant differences in SM levels from 4 to 8-h OGD. Ceramide levels were significantly increased after 8-h OGD. * p<0.05 and ** p<0.01 vs. control (0-h or no OGD) (n=4).
FIGURE 3
FIGURE 3. PLD2 protein expression increased after OGD in PC12 cells
(A) PLD2 Western blot (30 μg protein loaded). Caki-1 cell lysate was used as a reference for PLD. Relative changes in PLD2 protein expression are given as the ratio to controls levels (0 OGD) and normalized to β-actin. (B) PC12 cells were incubated under normoxic conditions in the presence of glucose and serum (control) or subjected to OGD for 8-h in the presence or absence of 0.3% n-butanol (n-BuOH). t-Butanol (t-BuOH) served as a control for n-BuOH and had no significant effect on cell viability after 8-h OGD. ** p<0.01 vs control; # p<0.05 vs 8-h OGD; @ p<0.01 vs control, not significant compared to 8-h OGD (n=4).
FIGURE 4
FIGURE 4. CCTα and N-SMase protein expression after OGD in PC12 cells
Western blots showing time course of (A) CCTα and (B) N-SMase protein expression in PC12 cells after OGD (100 μg protein loaded). A 78 kDa band, corresponding to the brain-specific N-SMase isoform N-SMase2 (Hofmann et al., 2000), was detected in PC12 cells. Relative changes in protein expression are given as the ratio to controls and normalized to β-actin.
FIGURE 5
FIGURE 5. PC-PLC inhibitor, D609 further increased cell death after OGD in PC12 cells
(A) D609 100 μM had no significant effect on cell viability during the first 3-h of OGD compared to OGD alone. However, from 3 to 4-h OGD, the viability of D609-treated cells declined to ~10%. * p<0.05 and ** p<0.01 vs 0-h OGD; ## p<0.01 vs. OGD without D609 (n=4). (B) PC12 cells were incubated under normoxic conditions in the presence of glucose and serum (control) or subjected to 4-h OGD in the presence or absence of 100 μM D609. PC12 cells subjected to OGD and treated with D609 were supplemented with either 4.5 mg/mL glucose, 5% equine and bovine sera, or oxygen (normoxic). * p<0.05 and ** p<0.01 vs control; ## p<0.01 vs OGD with D609 (n=4).
FIGURE 6
FIGURE 6. D609 increased PC and SM hydrolysis and ceramide generation during OGD in PC12 cells
PC12 cells were subjected to OGD in the presence or absence of 100 μM D609. Values are given as total fatty acids derived from respective lipids. (A) PC levels, * p<0.05 and ** p<0.01 vs. 0-h OGD (control); # p<0.05 and ## p<0.01 vs. OGD without D609 (n=4). (B) SM degradation in PC12 cells subjected to 4-h OGD and treated with 100 μM D609. ** p<0.01 vs. controls (0-h OGD); # p<0.05 vs. OGD alone (n=4). (C) Ceramide levels * p<0.05 vs. controls (0-h OGD) and vs 4-h OGD without D609 (n=4). (D) DAG levels in PC12 cells after OGD and treatment with D609 and 1 mM PC. ** p<0.01 vs control; ## p<0.01 vs 4-h OGD with D609 (n=4). (E) FFA levels in PC12 cells after OGD and treatment with D609 and 1 mM PC. ** p<0.01 vs control; ## p<0.01 vs 4-h OGD with D609 (n=4). D609 did not cause any changes in lipids when incubated with control PC12 cells for up to 4-h (normoxic conditions; PC 16.1 ± 1.1 nmol/106 cells; SM 1.13 ± 0.09 nmol/106 cells; ceramide 0.16 ± 0.01 nmol/106 cells and DAG 430 ± 39 pmol/106 cells; FFA 0.68 ± 0.054 nmol/106 cells).
FIGURE 7
FIGURE 7
(A). Effect of N-acetylcysteine (NAC) on total glutathione levels in PC12 cells after OGD and treatment with D609. ** p<0.01 compared to control, ## p<0.01 compared to 4-h OGD without D609, p<0.01 compared to 4-h OGD + D609. (B) PC12 cells were incubated under normoxic conditions in the presence of glucose and serum (control) or subjected to 4-h OGD in the presence or absence of 100 μM D609. PC12 cells subjected to OGD and treated with D609 were supplemented with either 25 mM N-acetylcysteine (NAC), 1 mM CDP-choline, 1 mM PC, 0.1 mM DAG, or (1 mM CDP-choline + 0.1 mM DAG). * p<0.05 and ** p<0.01 vs control; ## p<0.01 vs OGD with D609 (n=4).
FIGURE 8
FIGURE 8. Western blots for PARP and cytochrome c
D609 stimulated PARP cleavage and cytochrome c release from the mitochondria in PC12 cells subjected to OGD (n=4). Representative images are shown. PARP and its cleavage product were analyzed in the nuclear fraction of PC12 cells (30 μg protein loaded). PARP cleavage is expressed as the ratio of the intensity of the band at 89 kDa to the intensity of the band at 116 kDa. Cytochrome c was measured in the mitochondrial fraction (30 μg protein loaded). Relative intensities are expressed as the ratio to control. Cytochrome c was not detected in the cytosol fraction (blot not shown).
FIGURE 9
FIGURE 9. Confocal images: serum or PC prevented D609-induced cytochrome c release and PI staining in PC12 cells subjected to OGD
(n=4). Representative images have been shown. Cells were incubated with propidium iodine (PI) and fixed with 4% paraformaldehyde. Cells were then incubated with cytochrome c (Cyt. C) antibody and Alexa-Fluor 488-conjugated goat anti-mouse antibodies.. The fluorescence emissions for cytochrome c (green) and for PI (red) were recorded with a Leica DMIRE2 confocal microscope (40x). (A) Control cells showed punctate perinuclear staining for cytochrome c. (B) Cells subjected to 4-h OGD showed some PI staining, but viable cells with punctate perinuclear staining of cytochrome c were also observed. (C) After 4-h OGD with D609, almost all cells were stained by PI and most cells had lost cytochrome c. (D) when serum was incorporated into the media during 4-h OGD with D609, only a few cells stained for PI and cytochrome c showed mainly normal punctate peri-nuclear staining. (E) With addition of serum and glucose, cells appeared similar to controls. (F) Addition of 1 mM PC to the media during OGD with D609 prevented much of the cytotoxic effects of D609, but some cells still showed PI staining and loss of cytochrome c. (G) Addition of the PC precursor CDP-choline to the media during OGD with D609 had little effect on cell death. Most cells were PI-positive and had lost cytochrome c. A few cells that still had cytochrome c showed more diffuse staining, indicative of release in to the cytosol.
FIGURE 10
FIGURE 10. Flow cytometric analysis: D609 facilitated apoptosis PC12 cells after OGD as revealed by PS externalization/Annexin V binding (n=4)
Representative profiles have been shown. (A): The histogram of the Annexin V-PE signal indicated that 24% of control cells stained for PS. PC12 cells exposed to OGD for 3-h (B) and 4-h (C) showed in a moderate but significant increase in the number of Annexin V-PE positive cells. (D): Control PC12 cells exposed to 100 μM D609 for 4-h did not show any change in the number of Annexin V-PE positive cells. PC12 cells exposed to 100 μM D609 during OGD showed a significant increase in Annexin V-PE positive cells after 3-h OGD (E) and virtually all cells were Annexin V-PE positive after 4-h OGD (F). (G): CDP-choline (1 mM) resulted in a small but significant (p<0.05 compared to 4-h OGD with D609) decrease in the number of Annexin V-PE positive cells. (H): Inclusion of 1 mM PC resulted in a significant decrease (p<0.01 compared to 4-h OGD with D609) in the number of Annexin V-PE positive cells, a reduction similar to that observed by inclusion of glucose (I). Inclusion of serum (J) or glucose + serum (K) resulted in greatest reduction, near to control values, in the number of Annexin V-PE positive cells.
FIGURE 11
FIGURE 11. D609 increased [Ca2+]i of PC12 cells after OGD
[Ca2+]i concentrations in PC12 cells after OGD were determined using the fluorescent Ca2+ indicator fura-2 AM as described in the “Experimental” section. 3-h and 4-h OGD did not result in increased [Ca2+]i. 3-h and 4-h OGD in presence of D609 increased the [Ca2+]i significantly (** p<0.01 compared to 3-h and 4-h OGD without D609, respectively, and compared to control). There was no increase in [Ca2+]i in control PC12 cells (not subjected to OGD) exposed to D609 for 4-h. Exogenous PC significantly (# p<0.05 compared to 4-h OGD with D609) attenuated the increase in [Ca2+]i (by 37%) during 4-h OGD in PC12 cells treated with D609, but [Ca2+]i was still significantly elevated compared to 4-h OGD without D609 (p<0.01, n=4).
Scheme 1
Scheme 1
D609 inhibits PC (Ng et al., 2004) and SM (Luberto and Hannun, 1998) synthesis as well as PC-PLC (Amtmann, 1996). These additional effects must be taken into account in interpretation of results obtained with D609 and limit its utility as a pharmacological tool to characterize actions of PC-PLC and supports the notion that D609 is a non-specific PC-PLC inhibitor. PC-PLC hydrolyzes PC to form DAG and phosphocholine. DAG stimulates A-SMase and release of ceramide from SM. SM synthase transfers the phosphocholine head group from PC to ceramide to form SM and DAG. CPT synthesizes PC from CDP-choline and DAG. Since addition of CDP-choline + DAG also did not rescue the cells, in all likelihood D609 inhibits CPT (Anthony et al., 1999, Wright et al., 2001, Ng et al., 2004, 2004). PC: phosphatidylcholine; SM: sphingomyelin; A-SMase: acidic sphingomyelinase; PC-PLC: PC-phospholipase C; DAG: 1,2-diacylglycerol; CDP-C: CDP-choline; CPT: CDP-choline:DAG cholinephosphotransferase. In summary, D609 probably inhibits CPT and SM synthase as well as PC-PLC. The abrupt loss of cell viability also suggests that D609 might be causing loss of ATP followed by mitochondrial dysfunction (loss of cardiolipin) and increase in [Ca2+]i. These probable actions of D609 have been presented in the composite scheme.

Similar articles

Cited by

References

    1. Adibhatla RM, Hatcher JF. Phospholipase A2, reactive oxygen species, and lipid peroxidation in cerebral ischemia. Free Radic Biol Med. 2006;40:376–387. - PubMed
    1. Adibhatla RM, Hatcher JF. Secretory phospholipaseA2 IIA is up-regulated by TNF-α and IL-1α/β after transient focal cerebral ischemia in rat. Brain Res. 2007;1134:199–205. - PMC - PubMed
    1. Adibhatla RM, Hatcher JF, Dempsey RJ. Effects of citicoline on phospholipid and glutathione levels in transient cerebral ischemia. Stroke. 2001;32:2376–2381. - PubMed
    1. Adibhatla RM, Hatcher JF, Dempsey RJ. Cytidine-5′-diphosphocholine (CDP-choline) affects CTP:phosphocholine cytidylyltransferase and lyso-phosphatidylcholine after transient brain ischemia. J Neurosci Res. 2004;76:390–396. - PubMed
    1. Adibhatla RM, Hatcher JF, Larsen EC, Chen X, Sun D, Tsao F. CDP-choline significantly restores the phosphatidylcholine levels by differentially affecting phospholipase A2 and CTP-phosphocholine cytidylyltransferase after stroke. J Biol Chem. 2006;281:6718–6725. - PubMed

Publication types

MeSH terms

Substances