. 2007 Aug;11(4):341-50.
doi: 10.1016/j.jaapos.2007.01.119. Epub 2007 Apr 16.

Monocular activation of V1 and V2 in amblyopic adults measured with functional magnetic resonance imaging

Affiliations

Monocular activation of V1 and V2 in amblyopic adults measured with functional magnetic resonance imaging

Ian P Conner et al. J AAPOS. 2007 Aug.

Abstract

Purpose: Although previous neuroimaging efforts clearly indicate visual cortical dysfunction in adults with amblyopia, the extent of abnormalities remains unclear.

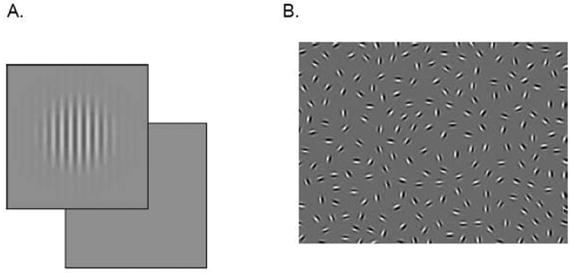
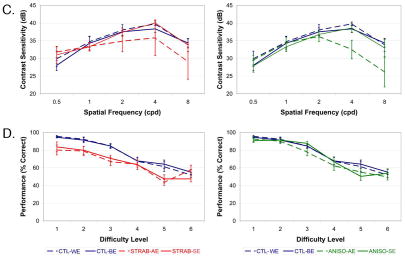
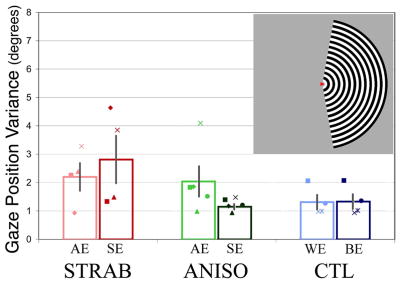
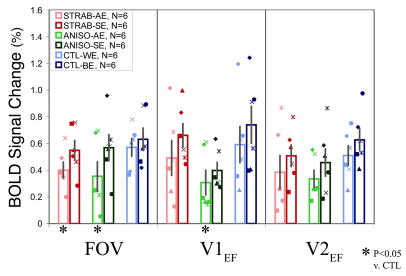
Methods: This functional magnetic resonance imaging (fMRI) study directly compared activity in visual cortex produced by monocular stimulation in 18 adults (six esotropic strabismics, six anisometropes, and six controls). Measures were made in three cortical regions-of-interest, individually defined using standard retinotopic mapping techniques in the nonamblyopic eye, corresponding to extrafoveal V1, extrafoveal V2, and the foveal representation at the occipital pole. Fixation stability was monitored and found not to differ significantly between subject groups.

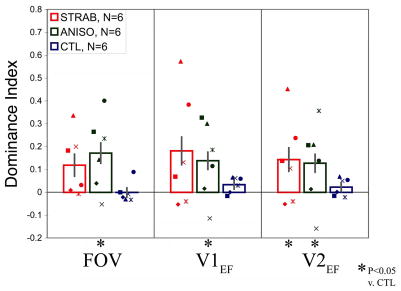
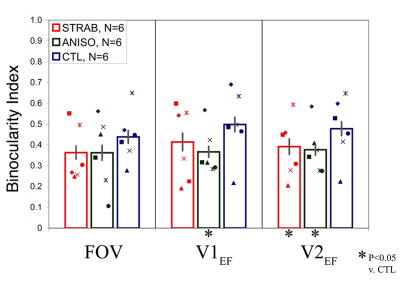
Results: Overall results showed depressed fMRI signal magnitude for amblyopic eyes compared with sound eyes, although a few subjects did not show this trend. Assessment of the spatial extent of activation using an ocular dominance index did show significantly larger interocular differences for both strabismics and anisometropes compared with control subjects for whom eye dominance was carefully defined. In addition, both amblyopic groups showed less cortical area able to be significantly driven by either eye. The magnitude of these effects was equivalent in V1, V2, and the foveal representation, as well as between amblyopic groups. No difference was detected in the strength of signal from the nasal versus temporal retina in either amblyopic group.

Conclusions: Asymmetries in magnitude of monocular activation do occur in subjects with amblyopia, but these basic measures are limited in terms of sensitivity for mild to moderate amblyopia and for specificity between subtypes.


Figures

Fig. 1
Fig. 1
Psychophysical Testing. A. Depiction of stimuli in 2-alternative-forced-choice contrast sensitivity test. B. Depiction of stimuli in contour integration test. C. Contrast sensitivity functions for strabismic and anisometropic subjects show deficits in the higher spatial frequency range. D. Contour integration is impaired at all levels for both amblyopic and sound eyes of strabismic subjects.
Fig. 1
Fig. 1
Psychophysical Testing. A. Depiction of stimuli in 2-alternative-forced-choice contrast sensitivity test. B. Depiction of stimuli in contour integration test. C. Contrast sensitivity functions for strabismic and anisometropic subjects show deficits in the higher spatial frequency range. D. Contour integration is impaired at all levels for both amblyopic and sound eyes of strabismic subjects.
Fig. 2
Fig. 2
fMRI Fixation Stability and BOLD Signal Magnitude. A. Upper right inset shows depiction of hemifield stimulus. The subject maintained fixation on the central “arrowhead” target. Fixation stability is shown for each group. No significant differences of fixation stability are seen for either intergroup or interocular comparisons. Group mean (open bars) and individual data are shown (from left-to-right, strabismic, anisometropic, and control). Saturated colors correspond to the better/sound eye (BE/SE) and lighter shades to the worse/amblyopic eye (WE/AE). Calibration error resulted in lack of eye tracking data in two strabismics (S5, S6), one anisometrope (A5), and two controls (C2, C3). B. Mean BOLD signal magnitude is depressed for every intergroup and interocular comparison, although a few amblyopic patients do not follow this trend (S2, S5, and A4, see text for details). There is also a consistent trend for less signal magnitude in control worse versus better eyes. Asterisks indicate significant intergroup differences.
Fig. 2
Fig. 2
fMRI Fixation Stability and BOLD Signal Magnitude. A. Upper right inset shows depiction of hemifield stimulus. The subject maintained fixation on the central “arrowhead” target. Fixation stability is shown for each group. No significant differences of fixation stability are seen for either intergroup or interocular comparisons. Group mean (open bars) and individual data are shown (from left-to-right, strabismic, anisometropic, and control). Saturated colors correspond to the better/sound eye (BE/SE) and lighter shades to the worse/amblyopic eye (WE/AE). Calibration error resulted in lack of eye tracking data in two strabismics (S5, S6), one anisometrope (A5), and two controls (C2, C3). B. Mean BOLD signal magnitude is depressed for every intergroup and interocular comparison, although a few amblyopic patients do not follow this trend (S2, S5, and A4, see text for details). There is also a consistent trend for less signal magnitude in control worse versus better eyes. Asterisks indicate significant intergroup differences.
Fig. 3
Fig. 3
Ocular Dominance and Binocularity Index by Group and ROI. A. Group data is shown for each region of interest (from left-to-right, strabismic, anisometropic, and control). Mean DI is shifted toward the sound eye for strabismic and anisometropic groups. B. Mean BI is reduced in all ROIs for strabismic and anisometropic amblyopes. Asterisks indicate significant differences. Labeling conventions are the same as in Fig. 2.
Fig. 3
Fig. 3
Ocular Dominance and Binocularity Index by Group and ROI. A. Group data is shown for each region of interest (from left-to-right, strabismic, anisometropic, and control). Mean DI is shifted toward the sound eye for strabismic and anisometropic groups. B. Mean BI is reduced in all ROIs for strabismic and anisometropic amblyopes. Asterisks indicate significant differences. Labeling conventions are the same as in Fig. 2.

References

    1. Campos E. Amblyopia. Surv Ophthalmol. 1995 July;40(1):23–39. - PubMed
    1. von Noorden GK, Campos EC. Binocular vision and ocular motility: Theory and management of strabismus. 6. St. Louis: Mosby; 2001.
    1. Daw NW. Critical periods and amblyopia. Arch Ophthalmol. 1998 April;116(4):502–5. - PubMed
    1. Abrahamsson M, Sjostrand J. Contrast sensitivity and acuity relationship in strabismic and anisometropic amblyopia. Br J Ophthalmol. 1988 January;72(1):44–9. - PMC - PubMed
    1. Asper L, Crewther D, Crewther SG. Strabismic amblyopia. Part 1. Psychophysics. Clin Exp Optom. 2000 March;83(2):49–58. - PubMed

Publication types