. 2008 Jan;18(1):114-25.
doi: 10.1093/cercor/bhm036. Epub 2007 Apr 13.

Cortical mechanisms for shifting and holding visuospatial attention

Affiliations

Cortical mechanisms for shifting and holding visuospatial attention

Todd A Kelley et al. Cereb Cortex. 2008 Jan.

Abstract

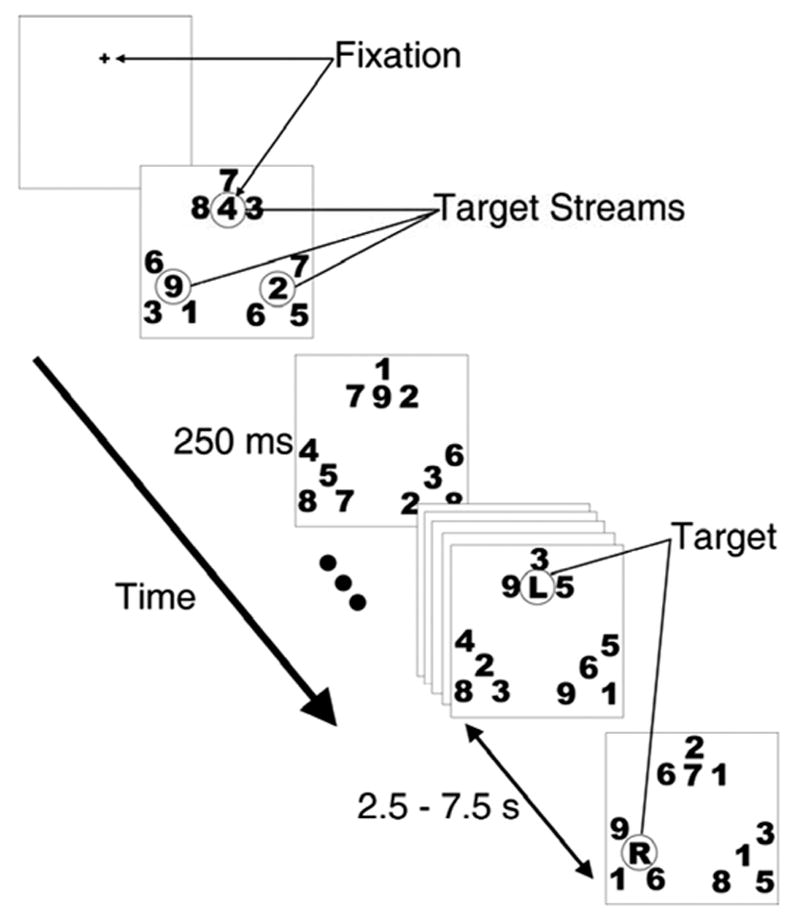
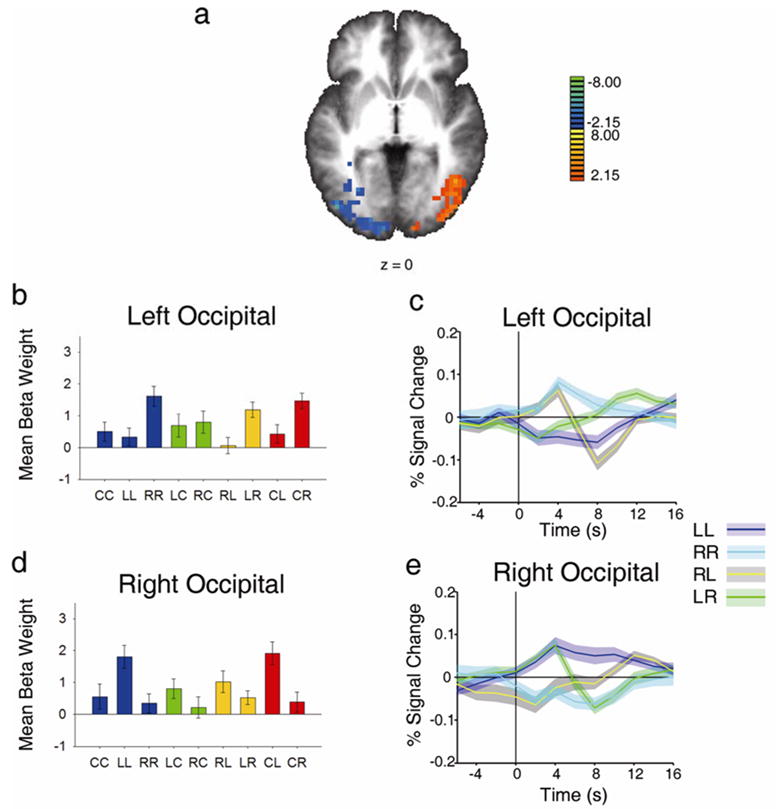
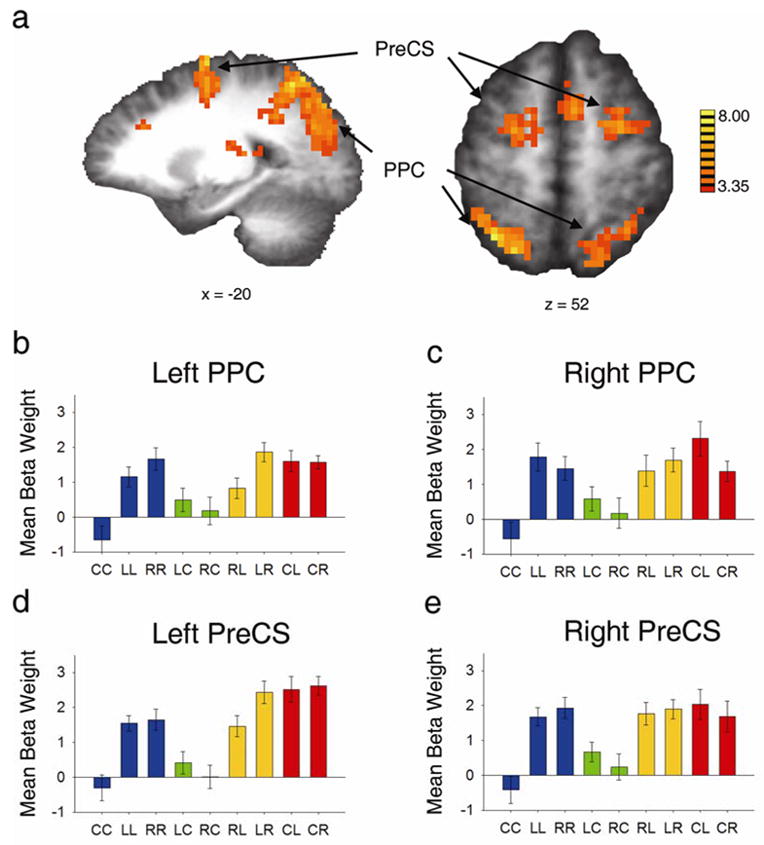
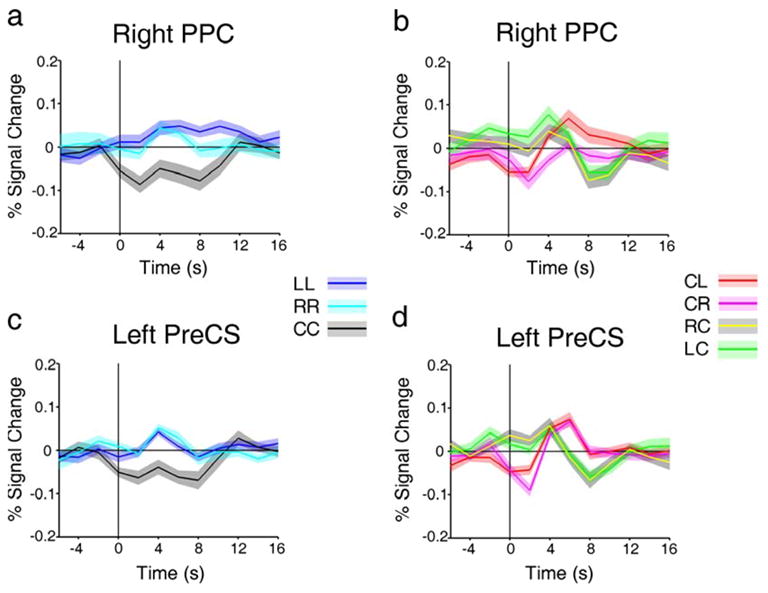
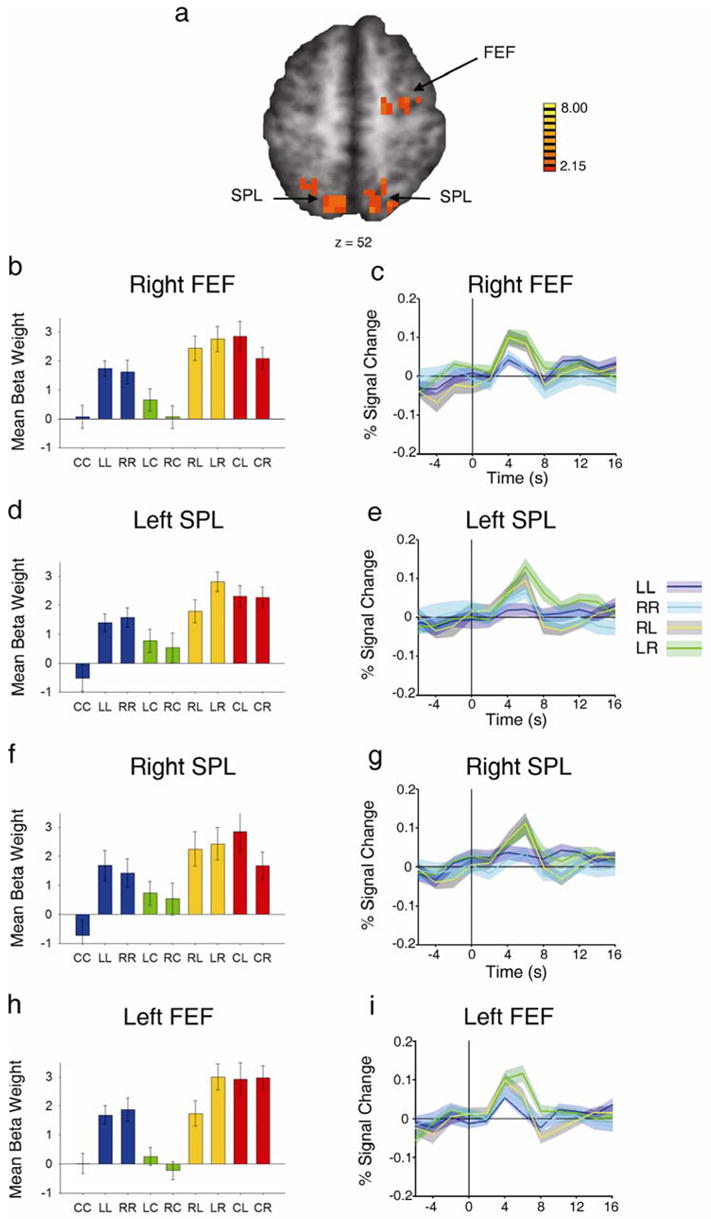
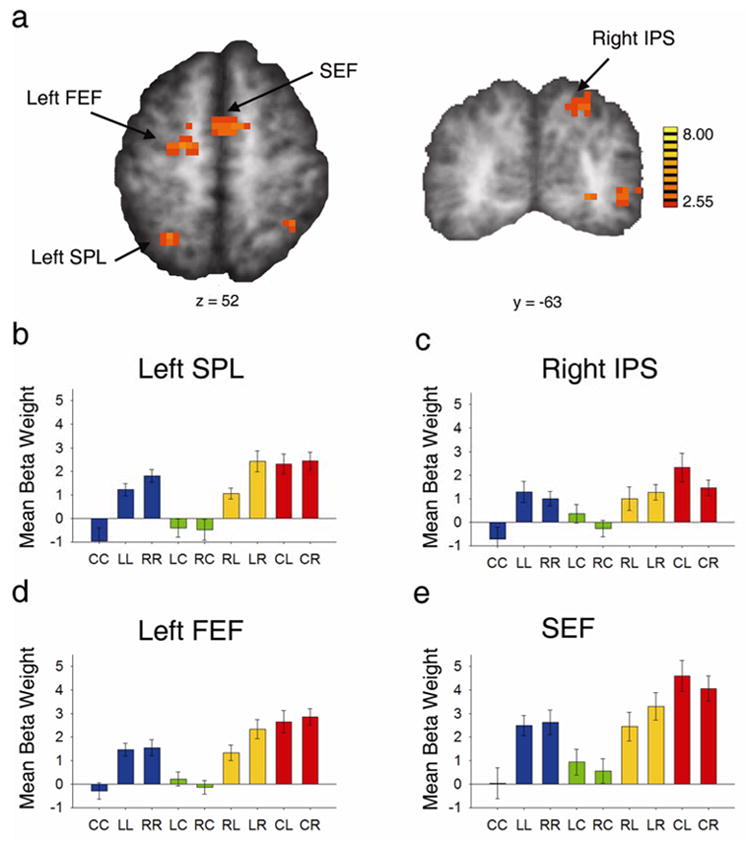
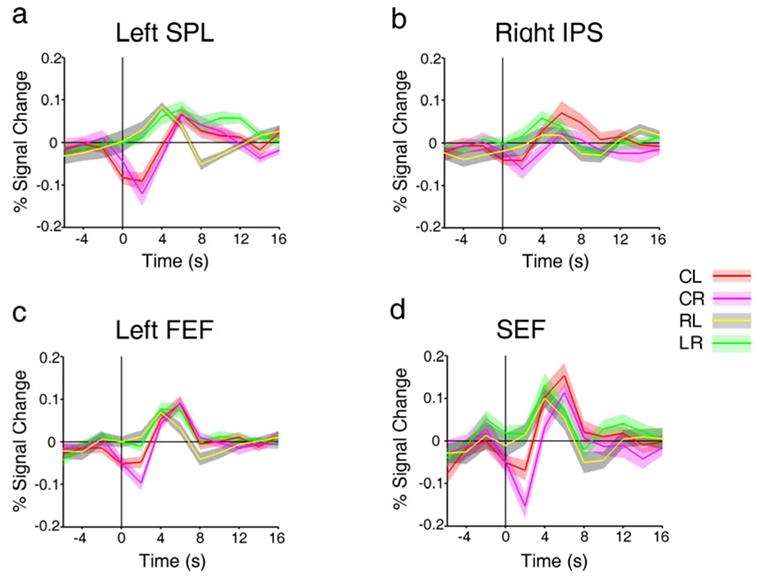
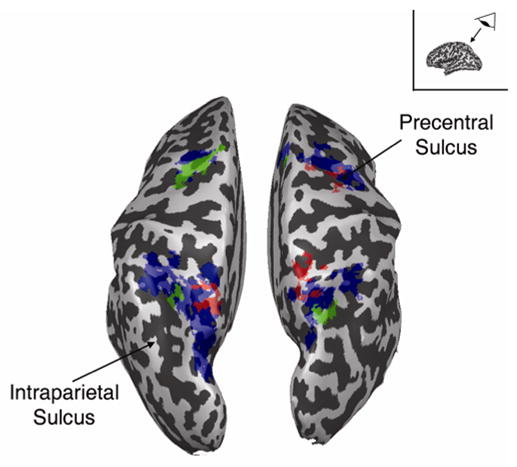
Access to visual awareness is often determined by covert, voluntary deployments of visual attention. Voluntary orienting without eye movements requires decoupling attention from the locus of fixation, a shift to the desired location, and maintenance of attention at that location. We used event-related functional magnetic resonance imaging to dissociate these components while observers shifted attention among 3 streams of letters and digits, one located at fixation and 2 in the periphery. Compared with holding attention at the current location, shifting attention between the peripheral locations was associated with transient increases in neural activity in the superior parietal lobule (SPL) and frontal eye fields (FEF), as in previous studies. The supplementary eye fields and separate portions of SPL and FEF were more active for decoupling attention from fixation than for shifting attention to a new location. Large segments of precentral sulcus (PreCS) and posterior parietal cortex (PPC) were more active when attention was maintained in the periphery than when it was maintained at fixation. We conclude that distinct subcomponents of the dorsal frontoparietal network initiate redeployments of covert attention to new locations and disengage attention from fixation, while sustained activity in lateral regions of PPC and PreCS represents sustained states of peripheral attention.


Figures

Figure 1
Figure 1
Rapid Serial Visual Presentation (RSVP) task. A fixation cross appeared for 1.5 seconds. Following the offset of the fixation cross, the three target and nine distractor streams appeared. One of the target streams appeared at fixation. Digits changed identity in each stream synchronously every 250 ms. The first target item, an “L”, a “C” or an “R”, appeared at fixation. Subjects pressed a button when a target was detected in the attended stream. The identity of the target cued the stream that should be attended next, requiring either a shift of attention or a hold. After a variable delay of 2.5 to 7.5 seconds (equaling 6 to 30 successive 250-ms stimulus frames), the next target appeared in the attended stream.
Figure 2
Figure 2
Attentional modulation of activity in extrastriate occipital cortex and parietal lobe (left side of the brain corresponds to left side of the image, for all figures). a Axial statistical t map showing activated regions of cortex, displayed on a group-averaged Talairach brain, for the contrast of LL vs. RR (warm colors represent activity related to attending left, and cool colors represent activity related to attending right). b and d, Beta weights for the nine event types in Left and Right Occipital lobe, respectively. All beta weights represent the mean of all voxels in a region, averaged across all subjects. c and e, Event-related time courses of LL, RR, LR and RL for Left and Right Occipital lobe, respectively. Shaded regions represent ± 1 SEM around each timepoint. Percent signal change at each time point is taken from the mean signal across all voxels, averaged across all subjects.
Figure 3
Figure 3
Increased cortical response for maintaining attention in the periphery compared to maintaining attention at fixation. a, Sagittal and axial views of statistical t map of regions active for LL and RR > CC in bilateral posterior parietal cortex (PPC) and precentral sulcus (PreCS) (refer to Table 2 for Talairach coordinates). b-e, Beta weights for the nine event types in left and right PPC and PreCS, respectively (see Figure 4 for the corresponding time courses).
Figure 4
Figure 4
Event-related time courses extracted from some of the ROIs depicted in Figure 3. a and c, Event-related time courses of LL, RR and CC in right PPC and left PreCS, respectively, showing same pattern of activity as beta weight plots (c.f. Figure 3). b and d, Event-related time courses of CL, CR, LC and RC in right PPC and left PreCS, respectively.
Figure 5
Figure 5
Increased cortical response to shift vs. hold targets. a, Statistical t map of regions active for RL and LR > LL and RR, revealing SPL and FEF activity (refer to Table 3 for Talairach coordinates). b, d,and f Beta weights for the nine event types in right FEF and left and right SPL, respectively. c, e and g, Event-related time courses of LL, RR, RL and LR for right FEF and left and right SPL, respectively. h and i, Plots of the beta weights for the nine event types and event-related time courses for LL, RR, RL and LR. These data were extracted from a portion of left prefrontal cortex defined by the mirror of the right FEF ROI.
Figure 6
Figure 6
Increased cortical response to shift from fixation to periphery vs. shift from one peripheral location to the other (CL and CR > LR and RL). a, Axial view of statistical t map, showing left SPL, left FEF, and SEF (refer to Table 4 for Talairach coordinates). b, Coronal view of the same contrast, showing right dorsal posterior IPS. c-f, Beta weights for the nine event types in left SPL, right IPS, left FEF, and SEF, respectively (see Figure 7 for the corresponding time courses).
Figure 7
Figure 7
a-d, Event-related time courses of CL, CR, LR and RL in left SPL, left FEF, right IPS and SEF, respectively.
Figure 8
Figure 8
Regions of interest shown in Figures 3, 5 and 6, projected onto the inflated cortical surface of a single subject, for the purpose of spatial comparison. Blue represents regions more active while attention was maintained in the periphery (LL and RR > CC); red represents areas that were transiently active for peripheral shifts of attention (RL and LR > LL and RR); green represents areas that were transiently active for decoupling attention from fixation (CL and CR > RL and LR). Of importance here is the lack of spatial overlap between the red and green areas.

References

    1. Andersen RA, Buneo CA. Intentional maps in posterior parietal cortex. Annu Rev Neurosci. 2002;25:189–220. - PubMed
    1. Astafiev SV, Shulman GL, Stanley CM, Snyder AZ, Van Essen DC, Corbetta M. Functional organization of human intraparietal and frontal cortex for attending, looking, and pointing. J Neurosci. 2003;23:4689–4699. - PMC - PubMed
    1. Awh E, Matsukura M, Serences JT. Top-down control of biased competition during covert spatial orienting. J Exp Psychol Hum Percept Perform. 2003;29:52–63. - PubMed
    1. Awh E, Armstrong KM, Moore T. Visual and oculomotor selection: links, causes and implications for spatial attention. Trends Cog Sci. 2006;10:124–130. - PubMed
    1. Boynton GM, Engel SA, Glover GH, Heeger DJ. Linear systems analysis of functional magnetic resonance imaging in human V1. J Neurosci. 1996;16:4207–4221. - PMC - PubMed

Publication types