. 2007 Jul 1;93(1):232-44.
doi: 10.1529/biophysj.106.102319. Epub 2007 Apr 13.

Spectroscopic and structural study of proton and halide ion cooperative binding to gfp

Affiliations

Spectroscopic and structural study of proton and halide ion cooperative binding to gfp

Daniele Arosio et al. Biophys J. .

Abstract

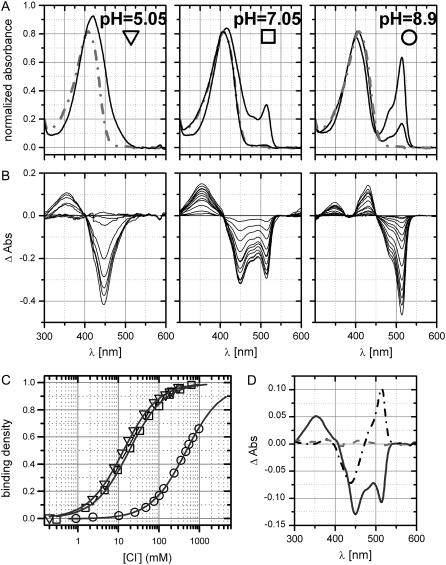
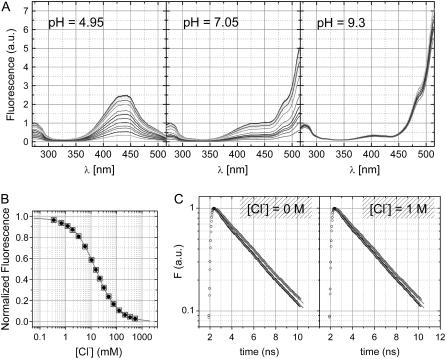
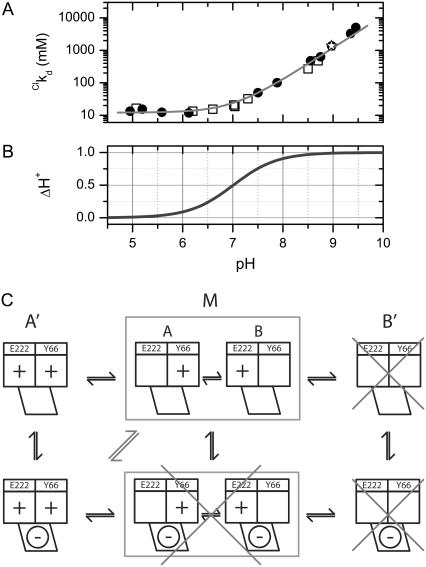
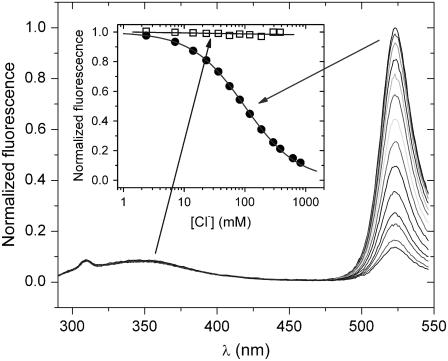
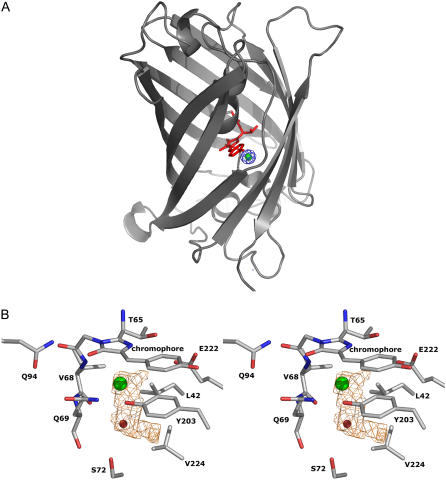
This study reports the influence of halogens on fluorescence properties of the Aequorea victoria Green Fluorescent Protein variant S65T/T203Y (E(2)GFP). Halide binding forms a specific nonfluorescent complex generating a substantial drop of the fluorescence via static quenching. Spectroscopic analysis under different solution conditions reveals high halogen affinity, which is strongly dependent on the pH. This evidences the presence in E(2)GFP of interacting binding sites for halide ions and for protons. Thermodynamic link and cooperative interaction are assessed demonstrating that binding of one halide ion is associated with the binding of one proton in a cooperative fashion with the formation, in the pH range 4.5-10, of a single fully protonated E(2)GFP.halogen complex. To resolve the structural determinants of E(2)GFP sensitivity to halogens, high-resolution crystallographic structures were obtained for the halide-free and I(-), Br(-), and Cl(-) bound E(2)GFP. Remarkably the first high-resolution (1.4 A) crystallographic structure of a chloride-bound GFP is reported. The chloride ion occupies a specific and unique binding pocket in direct contact (3.4 A) with the chromophore imidazolidinone aromatic ring. Unanticipated flexibility, strongly modulated by halide ion interactions, is observed in the region surrounding the chromophore. Furthermore molecular dynamics simulations identified E222 residue (along with the chromophore Y66 residue) being in the protonated state when E(2)GFP.halogen complex is formed. The impact of these results on high-sensitivity biosensor design will be discussed.


Figures

FIGURE 1
FIGURE 1
Room-temperature (20°C) absorption spectra (normalized at 278 nm) of E2GFP (dark) and EGFP (shaded) in the absence (dashed line, open symbols) and in the presence (solid line, solid symbols) of 1 M NaCl at pH = 6.8.
FIGURE 2
FIGURE 2
(A) E2GFP absorption spectra (normalized at 278 nm) at the three pH values: 5.05, 7.05, and 8.9 (from left to right) and increasing NaCl concentration (up to 1 M). Spectra at intermediate chloride concentration were omitted for graphical clarity. The spectrum collected at pH 5.05 and ∼400 mM NaCl is highlighted (shaded dash-dot line) in the left panel and overlaid (shaded dash-dot line) on the other two right panels. (B) Difference spectra corresponding to data of panel A. (C) Binding density derived from SVD analysis of the spectra reported in panel B. The solid lines show the fitting to the 1:1 binding model (Eq. 1) with fit parameter kd = 13.4 ± 0.2, 18.6 ± 0.8, and 478 ± 13 mM for pH = 5.05, 7.05, and 8.9, respectively. (D) First three basis difference spectra obtained by SVD analysis applied over all datasets reported in panel B. The first (solid), second (dash-dot), and third (shaded dash) basis vectors are weighted by the corresponding singular values: 7.7, 4.9, and 0.4.
FIGURE 3
FIGURE 3
(A) Fluorescence excitation spectra of E2GFP (normalized at 278 nm) collected with the emission wavelength set to 523 nm and at increasing chloride concentration (up to 1 M); and for three pH values: 4.95, 7.05, and 9.3 (from left to right). (B) Typical fluorescence isotherms obtained by integrating either the whole excitation spectra (270–515 nm) (solid circles) or the emission peak (495–540 nm) (open squares) after excitation at 274 nm (pH = 5.2 ± 0.05 and temperature 20°C). The solid line was obtained by data fitting to 1:1 binding Eq. 1 with kd = 15.4 ± 0.2 mM, F0 = 0.981 ± 0.002, and F1 = 0.005 ± 0.003. (C) Fluorescence decay time traces after excitation at 475 nm for E2GFP at pH values 7.4 and 9.4 in the absence (left-handed panel) and in the presence (right-handed panel) of 1 M NaCl. Single exponential decay fit (solid lines) give, at pH 7.4, τ = 3.24 ± 0.05 and 3.33 ± 0.05 ns in the absence and in the presence of chloride, respectively; and at pH 9.4, τ = 3.59 ± 0.04 and 3.64 ± 0.04 ns. Experimental conditions are described in Materials and Methods.
FIGURE 4
FIGURE 4
(A) Linkage between H+ and Cl binding to E2GFP represented as the change in the logarithm of chloride dissociation constant as a function of pH. Data derived from fluorescence (open circles) and from absorbance (open squares) measurements are reported. The solid line was obtained by global data fitting to Eq. 6 with fit parameters: 0pka = 7.01 ± 0.13, (1/1kCl) = 12.1 ± 0.1 mM, and (1/0kCl) ≥ 2.5 × 1044 mM. Experimental conditions, described in Materials and Methods, are 20°C and 1 M ionic strength, except for the point at pH = 9.0 (open star) that was collected at 4 M. (B) Net number of H+ exchanged upon Cl binding derived from the data reported in panel A according to Eq. 7. (C) Local binding linkage scheme that considers two H+ (chromophore Y66, E222) and one Cl (halogen-binding cavity, see Fig. 8, B) binding sites.
FIGURE 5
FIGURE 5
Fluorescence emission spectra (normalized at 523 nm) of E2GFP collected at pH 7.9 and increasing chloride concentration (up to 1 M). The excitation wavelength set to 280 nm and temperature to 20°C. In the inset, fluorescence isotherms obtained by integrating the peak at ∼350 nm (310–390 nm) (open squares) and at 523 nm (495–540 nm) (solid circles) are shown. Solid lines are, respectively, the fit to a straight line and to Eq. 2 (with fit parameters: kd = 102.1 ± 1.4, F0 = 0.993 ± 0.003).
FIGURE 6
FIGURE 6
Stereo-view of the E2GFP chromophore region. The chromophore region of YFP protein is colored in magenta and superimposed for comparison.
FIGURE 7
FIGURE 7
(A,B) Conformational changes involving the O3-C3 carbonyl bond between the closed (A) (E2GFP) and open (B) (E2GFP·Cl) form. Water molecule and chloride are rendered as red and green spheres, respectively. Map shown is 2Fo-Fc contoured at 2δ. (C,D) Schematic representation of the closed (C) and open (D) conformations of E2GFP shows conformational changes and hydrogen bonding pattern around the chromophore.
FIGURE 8
FIGURE 8
(A) Ribbon representation of the E2GFP·Cl complex crystal structure. The chromophore is shown in stick representation and colored in red. The 2Fo-Fc electron density map at 5δ corresponding to the area where the chloride anion was modeled, is in blue. The phases were calculated from a refined model lacking the chloride ion. The refined bonded chloride anion has been superimposed and represented as a green sphere. (B) Stereo-view of the chromophore region of E2GFP·Cl complex. The chloride ion and water molecule Wat252 are represented as green and red spheres, respectively. The volume (≈10 Å3) of the halogen-binding cavity is represented in orange.
FIGURE 9
FIGURE 9
(A) Fluorescence quenching (Stern-Volmer plot) of E2GFP with different halogens. Data collected at 23°C and pH = 7.95 ± 0.05. Fit parameter kd = 22.6 ± 0.3, 42.9 ± .9, 74.3 ± 1.3, and 182.6 ± 2 for I, Br, F, and Cl, respectively. (B) Fluorescence quenching (Stern-Volmer plot) at increasing chloride concentration for the GFP variants: E0GFP (−/−), EGFP (S56T/−), E1GFP (−/T203Y), and E2GFP (S65T/T203Y).

References

    1. Ormo, M., A. B. Cubitt, K. Kallio, L. A. Gross, R. Y. Tsien, and S. J. Remington. 1996. Crystal structure of the Aequorea victoria green fluorescent protein. Science. 273:1392–1395. - PubMed
    1. Li, X., G. Zhang, N. Ngo, X. Zhao, S. R. Kain, and C. C. Huang. 1997. Deletions of the Aequorea victoria green fluorescent protein define the minimal domain required for fluorescence. J. Biol. Chem. 272:28545–28549. - PubMed
    1. Creemers, T. M., A. J. Lock, V. Subramaniam, T. M. Jovin, and S. Volker. 2000. Photophysics and optical switching in green fluorescent protein mutants. Proc. Natl. Acad. Sci. USA. 97:2974–2978. - PMC - PubMed
    1. Subramaniam, V., Q. S. Hanley, A. H. Clayton, and T. M. Jovin. 2003. Photophysics of green and red fluorescent proteins: implications for quantitative microscopy. Methods Enzymol. 360:178–201. - PubMed
    1. Jung, G., J. Wiehler, and A. Zumbusch. 2005. The photophysics of green fluorescent protein: influence of the key amino acids at positions 65, 203, and 222. Biophys. J. 88:1932–1947. - PMC - PubMed

Publication types

LinkOut - more resources