. 2007 Jul 1;93(1):303-15.
doi: 10.1529/biophysj.106.102962. Epub 2007 Apr 13.

On kinetics of phage adsorption

Affiliations

On kinetics of phage adsorption

R Moldovan et al. Biophys J. .

Abstract

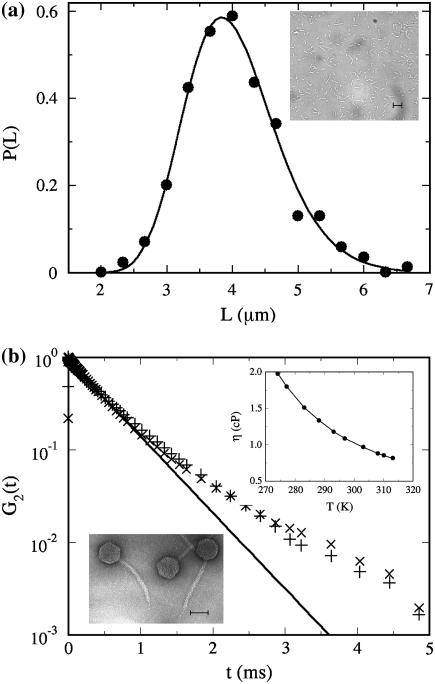
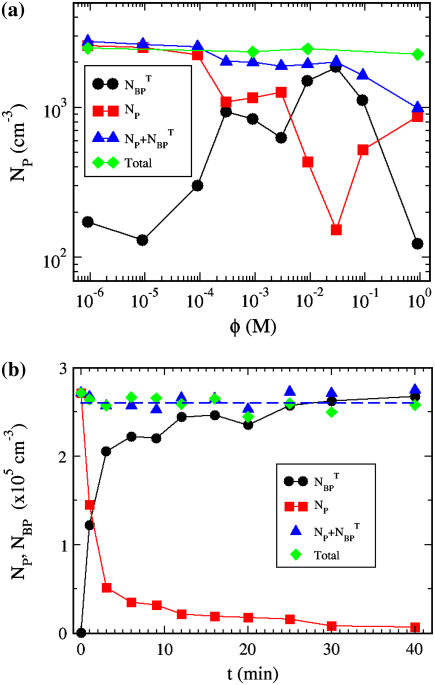
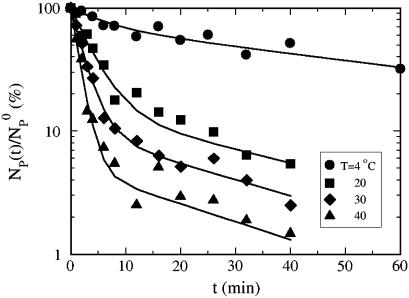
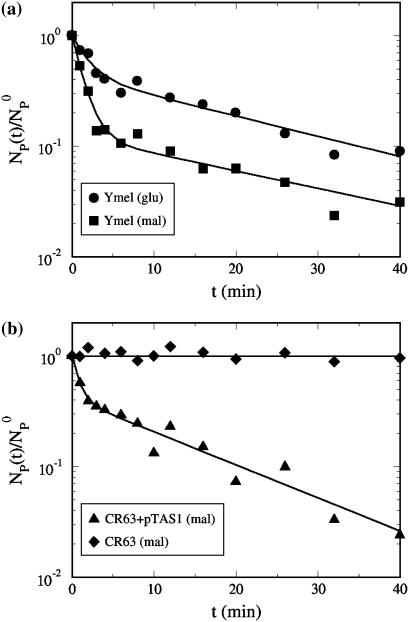
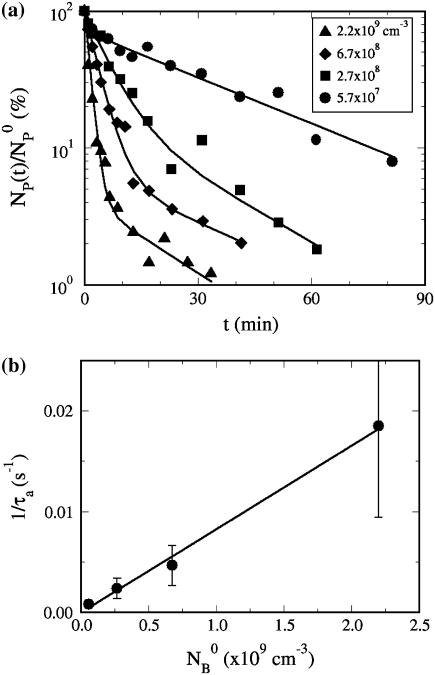
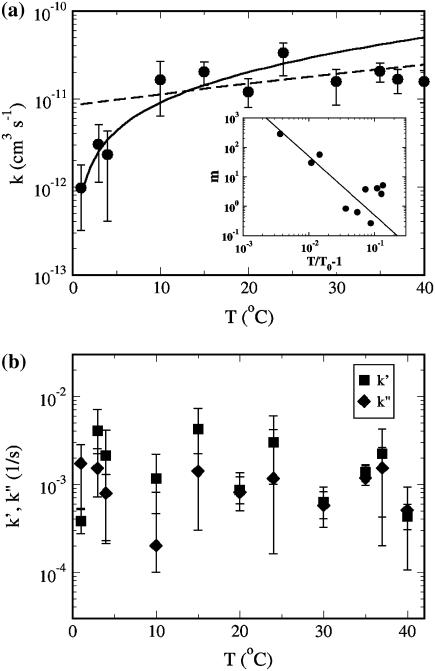
Adsorption of lambda-phage on sensitive bacteria Escherichia coli is a classical problem but not all issues have been resolved. One of the outstanding problems is the rate of adsorption, which in some cases appears to exceed the theoretical limit imposed by the law of random diffusion. We revisit this problem by conducting experiments along with new theoretical analyses. Our measurements show that upon incubating lambda-phage with bacteria Ymel, the population of unbound phage in a salt buffer decreases with time and in general obeys a double-exponential function characterized by a fast (tau(1)) and a slow (tau(2)) decay time. We found that both the fast and the slow processes are specific to interactions between lambda-phage and its receptor LamB. Such specificity motivates a kinetic model that describes the interaction between the phage and the receptor as an on-and-off process followed by an irreversible binding. The latter may be a signature of the initiation of DNA translocation. The kinetic model successfully predicts the double exponential behavior seen in the experiment and allows the corresponding rate constants to be extracted from single measurements. The weak temperature dependence of the reversible and the irreversible binding rate suggests that phage retention by the receptor is entropic in nature and that a molecular key-lock interaction may be an appropriate description of the interaction between the phage tail and the receptor.


Figures

FIGURE 1
FIGURE 1
(a) The size distribution of Ymel grown to the midexponential phase (3.5 h) in the M9 medium supplemented with 0.4% glucose. The inset shows a typical image with the scale bar of 5 μm. The size distribution can be mimicked reasonably well by a log-normal distribution formula image as delineated by the solid line in the figure. Here μ = 1.38 is the mean of ln(L) and σ = 0.2 is its standard deviation. (b) The scattered light intensity-intensity autocorrelation function G2(t) = 〈I(t′)I(t′ + t)〉/〈I(t′) 〉2−1 measured using λ-phage (pluses) and λ-phage heads (crosses) in the λ-buffer. The measurement was carried at room temperature T = 24°C and at the scattering angle of θ = 90°. This corresponds to the scattering wavenumber q(= 4πnsin(θ/2)/Λ) = 1.87 × 105 cm−1, where n is the index of refraction of water and Λ = 633 nm is the wavelength of the HeNe laser. The data shows that the phage tail does not contribute significantly to the decay of the autocorrelation function; i.e., the diffusion constant is essentially determined by the phage head. As can also be seen in the figure, for early times G2(t) decays exponentially and can be compared to the theoretical predictions for spheres diffusing in a medium with viscosity η: G2(t) = exp(−2D3q2t), where D3 = kBT/6πηR is the diffusion coefficient for the sphere of radius R. This measurement yields the hydrodynamic radius R = 35 nm. The inset in the upper corner is the plot of the measured shear viscosity η for the λ-buffer, which is essentially the same as water. The lower inset is an electron microscopy image of intact λ-phage. Here the scale bar is 50 nm (courtesy of R. Hendrix).
FIGURE 2
FIGURE 2
Phage adsorption is strongly dependent on salt concentrations. (a) The magnesium salt is varied over four decades in concentrations φ and the free λ-phage (squares) are titered after incubating with Ymel bacteria for 6 min in each salt concentration. The different symbols (squares, circles, triangles, and diamonds) correspond to free phage, bacterium/phage complexes, the sum of free phage and bacterium/phage complexes, and initial phage concentration, respectively. (b) The total bacterium/phage complex formula image = NBP + NBP* (circles) and free phage NP (squares) concentrations as a function of adsorption time t. The MgSO4 concentration is 10 mM. All measurements in panels a and b were carried out in room temperature.
FIGURE 3
FIGURE 3
The temperature-dependent adsorption curves. The bacteria were grown in the minimal M9 medium supplemented with 0.4% glucose. The reactions were carried out in the λ-buffer. The normalized free phage concentration is plotted as a function of time for different temperatures. Here, triangles, diamonds, squares, and circles correspond to T = 40, 30, 20, and 4°C, respectively. The solid lines are fits to the data (see text for details).
FIGURE 4
FIGURE 4
(a) Phage adsorption kinetics using Ymel grown in M9 with different carbon supplements. The adsorption measurements were carried out at room temperature and in the λ-buffer. The circles are for the glucose-grown cells and the squares are for the maltose-grown cells. It is clear from the graph that adsorption for maltose-grown cells is faster, indicating a higher level of LamB expression. (b) The same measurement was also carried out using E. coli CR63 (diamonds). In this case, the concentration of free phage remained constant, indicating no discernible adsorption. However, when the CR63 bacteria were transformed by inserting the plasmid pTAS1 that constitutively expresses LamB, the ability for cells to adsorb λ-phage was recovered (triangles).
FIGURE 5
FIGURE 5
The formula image dependence. In panel a, four different measurements (circles, squares, diamonds, and triangles) corresponds respectively to formula image 5.7 × 10⁷, 2.7 × 10⁸, 6.7 × 10⁸, and 2.2 × 109 cm−3. The measurements were performed in room temperature. In panel b, the linear dependence of 1/τa vs. formula image is observed. The slope gives the adsorption constant k = 9 × 10⁻¹² cm3 s−1.
FIGURE 6
FIGURE 6
The adsorption rate constants k, k′, and k″. (a) The measured k is nearly independent of T for T > 10°C but it drops sharply for T < 10°C. The dotted line takes into account T-dependent viscosity η of the medium. The solid line takes into account both T-dependent η and the aggregation of receptors (see text for details). The inset depicts the aggregation number m = N/M as a function of the reduced temperature T/T0−1, where T0 = 274 K. The data can be approximated as a power law in reduced temperature as m ∼ (T/T0−1)α, where the exponent α is ∼2 as delineated by the solid line in the inset. (b) The desorption rate constant k′ and the irreversible binding constants k″. Within noise, these rate constants show no systematic T dependence.
FIGURE 7
FIGURE 7
Fluorescent images of bacterium/phage complexes. Fluorescently labeled λ-phage were bound to Ymel at 37°C (a) and at 4°C (b), but the observation was made at room temperature. The labeling was carried out using a saturating amount of λ-phage (moi ≈ 2000) and incubated over 40 min in the λ-buffer. The uniformity of fluorescence indicates how the phage (or LamB receptors) are distributed on the bacterial cell wall. These images indicate that receptor distribution becomes less uniform as T is reduced, and is suggestive that they form large patches.
FIGURE 8
FIGURE 8
Interactions between a bacteriophage and a receptor. Panel a depicts the hypothetical key-lock interactions between λ-phage and a LamB receptor. The detailed drawing inside the dotted line box is shown in panel b. As the drawing suggests, the rotational diffusion of the phage particle can make it either free or permanently bound to the receptor.

References

    1. Hershey, A. D., and M. Chase. 1952. Independent functions of viral protein and nucleic acid in growth of bacteriophage. J. Gen. Physiol. 36:39–56. - PMC - PubMed
    1. Luria, S. E., and M. Delbruck. 1943. Mutations of bacteria from virus sensitivity to virus resistance. Genetics. 28:491–511. - PMC - PubMed
    1. Crick, F. 1970. Central dogma of molecular biology. Nature. 227:561–563. - PubMed
    1. Schwartz, M. 1980. Interaction of phages with their receptor proteins. In Virus Receptors (Receptors and Recognition, Series B). L. L. Randall and L. Philipson, editors. Chapman and Hall, London, UK.
    1. Schlesinger, M. 1932. Adsorption of bacteriophages to homologous bacteria. II. Quantitative investigation of adsorption velocity and saturation. Estimation of the particle size of the bacteriophage. Z. Hyg. Infektionskr. 114:149–160.

Publication types

LinkOut - more resources