. 2007 Jun;6(6):919-30.
doi: 10.1128/EC.00207-06. Epub 2007 Apr 13.

Acclimation to singlet oxygen stress in Chlamydomonas reinhardtii

Affiliations

Acclimation to singlet oxygen stress in Chlamydomonas reinhardtii

Heidi K Ledford et al. Eukaryot Cell. 2007 Jun.

Abstract

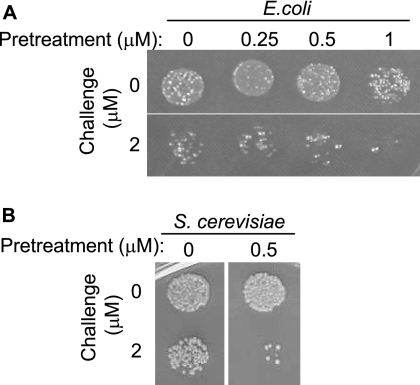
In an aerobic environment, responding to oxidative cues is critical for physiological adaptation (acclimation) to changing environmental conditions. The unicellular alga Chlamydomonas reinhardtii was tested for the ability to acclimate to specific forms of oxidative stress. Acclimation was defined as the ability of a sublethal pretreatment with a reactive oxygen species to activate defense responses that subsequently enhance survival of that stress. C. reinhardtii exhibited a strong acclimation response to rose bengal, a photosensitizing dye that produces singlet oxygen. This acclimation was dependent upon photosensitization and occurred only when pretreatment was administered in the light. Shifting cells from low light to high light also enhanced resistance to singlet oxygen, suggesting an overlap in high-light and singlet oxygen response pathways. Microarray analysis of RNA levels indicated that a relatively small number of genes respond to sublethal levels of singlet oxygen. Constitutive overexpression of either of two such genes, a glutathione peroxidase gene and a glutathione S-transferase gene, was sufficient to enhance singlet oxygen resistance. Escherichia coli and Saccharomyces cerevisiae exhibit well-defined responses to reactive oxygen but did not acclimate to singlet oxygen, possibly reflecting the relative importance of singlet oxygen stress for photosynthetic organisms.


Figures

FIG. 1.
FIG. 1.
C. reinhardtii acclimates to singlet oxygen. (A) Schematic of acclimation assays. C. reinhardtii was assayed for an ability to acclimate to oxidative stress following pretreatment with sublethal levels of that stress. Cells were pretreated and challenged with reactive oxygen species in liquid cultures and then plated on agar medium to assay survival. Acclimation was defined as the ability of pretreated cells to survive what would otherwise be a lethal challenge level. (B) Assay for acclimation to RB. Wild-type cells were grown photoautotrophically and pretreated in HS liquid medium for 2 h with 2 μM RB and then challenged for 1 h using the indicated concentrations. Pretreatment and challenge were carried out in 100-ml cultures at 50 μmol photons m−2 s−1. Aliquots were serially diluted and plated on TAP medium, and colonies were counted to assay the viability of the original cultures.
FIG. 2.
FIG. 2.
Light and solvent dependency of responses to RB. (A) Light dependency of acclimation to RB. Cells were pretreated and challenged in the light (50 μmol photons m−2 s−1; indicated by a sun) or the dark (indicated by a moon). Pretreatment lasted 2 h, and challenge levels lasted 1 h. Cells were grown and treated in TAP liquid medium, and a 3-μl aliquot was spotted onto TAP plates as a viability assay. (B) Solvent dependency of RB toxicity. Cells were treated with the indicated concentrations of RB for 1 h either in normal aqueous TAP medium (H2O) or in TAP medium containing 95% (vol/vol) deuterium oxide (D2O).
FIG. 3.
FIG. 3.
Acclimation to 1O2* is rapid and transient. (A) Cells were grown photoautotrophically to mid-exponential phase, then pretreated with various RB concentrations and durations (duration of pretreatment is indicated below each photo), and challenged for 1 h at the concentrations shown. Aliquots were spotted onto TAP agar medium to assay viability. (B) Transience of acclimation to 1O2*. Cells were grown photoautotrophically to mid-exponential phase, pretreated (+) with 2 μM RB for 2 h, and then challenged with 8 μM RB for 1 h. A 3-μl aliquot from each sample was spotted onto TAP agar medium as an assay of viability. The remaining culture from the sample that was pretreated and challenged was washed with fresh HS medium and incubated for 24 h, at which time the pretreatment and challenge were repeated. Aliquots were again spotted onto TAP agar medium, shown in the right photo.
FIG. 4.
FIG. 4.
Cross-acclimation between 1O2* and other sources of oxidative stress. (A) Cross-acclimation between 1O2* and other ROS. Cells were grown photoautotrophically, pretreated (+) with 2 μM RB for 2 h at 50 μmol photons m−2 s−1, and then challenged for 1 h at the same light intensity with either RB (0, 6, 8, 10, and 12 μM), neutral red (NR; 0, 4, 6, 8, 10 μM), tert-butyl hydroperoxide (tBOOH; 0, 0.25, 0.5, 0.75, and 1 mM), metronidazole (MZ; 0, 2, 3, 4, 6 mM), and methyl viologen (MeV; 0, 0.5, 1, 1.5, and 2 μM). (B) Cross-acclimation between 1O2* and HL. Cultures were grown photoautotrophically at 50 μmol photons m−2 s−1 (LL) and then pretreated by shifting to 500 μmol photons m−2 s−1 (HL) for 1 h prior to challenging with the indicated concentrations of RB for 5 h at LL.
FIG. 5.
FIG. 5.
Acclimation does not involve changes in cellular carotenoid or α-tocopherol content or composition. Photoautotrophically grown cells were pretreated with 2 μM RB for 2 h at 50 μmol photons m−2 s−1 and then challenged for 1 h with 12 μM RB. Error bars represent standard errors from four biological replicates. Gray shaded bars, cells not pretreated; white bars, cells not pretreated but challenged; speckled bars, pretreated cells; striped bars, pretreated and challenged cells. The xanthophyll cycle pool is the sum of violaxanthin, antheraxanthin, and zeaxanthin. β-car, β-carotene; α-toc, α-tocopherol; Chl a, chlorophyll a.
FIG. 6.
FIG. 6.
Pretreatment with 1O2* causes changes in gene expression. (A) Volcano plot of microarray results comparing pretreated cells with unpretreated cells. Log2-transformed gene expression ratios are plotted on the x axis against log10-transformed P values (log10pval). Genes with statistically different expression levels (P value of ≤1 × 10⁻⁴) and changes greater than 1.5-fold are considered to be induced, and genes with statistically different expression levels and changes less than −1.5-fold are considered to be repressed. These genes fall within the boxes in the upper right and upper left corners of the graph, respectively. (B) RNA gel blot confirmation of microarray results. Cells were grown in TAP medium at either 50 μmol photons m−2 s−1 (“light”) or in the dark. Pretreatment was 2 μM RB for 2 h, and challenge was 10 μM RB for 1 h. Five micrograms of RNA was loaded in each lane, and a methylene blue stain of rRNA was used as a loading control. Blots shown here are representative of two biological replicates. The levels of GPXH (glutathione peroxidase 1), GSTS1 (glutathione S-transferase 1), GSTS2 (glutathione S-transferase 2), PHC8 (pherophorin C8), and APX1 (ascorbate peroxidase) genes are shown. 5327 refers to the EST contig 20021010.5327.
FIG. 7.
FIG. 7.
Impact of endogenous photosensitizers on GPXH and GSTS1 expression. (A) RNA gel blot analysis of pc1 y7 cells transferred from dark to LL. The protochlorophyllide-accumulating mutant pc1 y7 and the wild type (WT) were grown in TAP medium in the dark and then shifted to 50 μmol photons m−2 s−1 (LL). RNA samples were taken at the indicated time points, and 5 μg of total RNA was loaded in each lane. Methylene blue staining of rRNA was used as a loading control, and the mutant and wild-type blots were hybridized together to the same probe. Both blots are representative of two biological replicates. (B) RNA gel blot analysis of wild type transferred from LL to HL. Wild-type cells were grown photoautotrophically in LL and then shifted to 500 μmol photons m−2 s−1. Total RNA was extracted at the indicated times, and 5 μg of total RNA was run in each lane. Methylene blue staining of rRNA was used as a loading control, and both blots are representative of two biological replicates.
FIG. 8.
FIG. 8.
Oxidative stress-induced changes in gene expression. Cells were grown photoautotrophically at 50 μmol photons m−2 s−1 and treated with the indicated compounds (tBOOH, tert-butyl hydroperoxide; MZ, metronidazole). Concentrations used did not result in cell death during 12 h of treatment. Five micrograms of total RNA was loaded in each lane, and a methylene blue stain of the blot was used as an rRNA loading control. Blots shown here are representative of two biological replicates.
FIG. 9.
FIG. 9.
Constitutive overexpression of GPXH and GSTS1 confers resistance to 1O2*. (A) RNA gel blot analysis of ProPSAD:GPXH transformants. RNA was extracted from heterotrophically grown paromomycin-resistant transformants containing the ProPSAD:GPXH overexpression construct. Five micrograms of RNA was loaded in each lane, and methylene blue staining of the blot was used as a loading control. “pSL18” refers to transformants that contain an empty vector control. (B) RNA gel blot analysis of ProPSAD:GSTS1 transformants. RNA was extracted from heterotrophically grown paromomycin-resistant transformants containing the ProPSAD:GSTS1 overexpression construct. Five micrograms of RNA was loaded in each lane, and methylene blue staining of the blot was used as a loading control. “pSL18” refers to transformants that contain an empty vector control. (C) Phenotypes of ProPSAD:GPXH and ProPSAD:GSTS1. GPXH- and GSTS1-overexpressing transformants were grown in TAP liquid cultures, then plated onto TAP plates containing either 1.5 μM RB or 4 μM neutral red (NR), and grown at 100 μmol photons m−2 s−1. pSL18A1 is a control transformant containing the empty vector.
FIG. 10.
FIG. 10.
Screens for acclimation to 1O2* in E. coli and S. cerevisiae. E. coli and S. cerevisiae cultures were pretreated with the indicated RB concentrations for 2 h, then challenged for 1 h, and plated.
FIG. 11.
FIG. 11.
Model of acclimation to 1O2* in C. reinhardtii. Pchlide, protochlorophyllide; LOOH, lipid hydroperoxide.

References

    1. Agianian, B., P. A. Tucker, A. Schouten, K. Leonard, B. Bullard, and P. Gros. 2003. Structure of a Drosophila sigma class glutathione S-transferase reveals a novel active site topography suited for lipid peroxidation products. J. Mol. Biol. 326:151-165. - PubMed
    1. Alic, N., T. Felder, M. D. Temple, C. Gloeckner, V. J. Higgins, P. Briza, and I. W. Dawes. 2004. Genome-wide transcriptional responses to a lipid hydroperoxide: adaptation occurs without induction of oxidant defenses. Free Radic. Biol. Med. 37:23-35. - PubMed
    1. Anthony, J. R., K. L. Warczak, and T. J. Donohue. 2005. A transcriptional response to singlet oxygen, a toxic byproduct of photosynthesis. Proc. Natl. Acad. Sci. USA 102:6502-6507. - PMC - PubMed
    1. Apel, K., and H. Hirt. 2004. Reactive oxygen species: metabolism, oxidative stress, and signal transduction. Annu. Rev. Plant Biol. 55:373-399. - PubMed
    1. Avery, A. M., and S. V. Avery. 2001. Saccharomyces cerevisiae expresses three phospholipid hydroperoxide glutathione peroxidases. J. Biol. Chem. 276:33730-33735. - PubMed

Publication types

MeSH terms

Associated data