. 2007 Jun;176(2):1261-81.
doi: 10.1534/genetics.106.069641. Epub 2007 Apr 15.

Joint estimates of quantitative trait locus effect and frequency using synthetic recombinant populations of Drosophila melanogaster

Affiliations

Joint estimates of quantitative trait locus effect and frequency using synthetic recombinant populations of Drosophila melanogaster

Stuart J Macdonald et al. Genetics. 2007 Jun.

Abstract

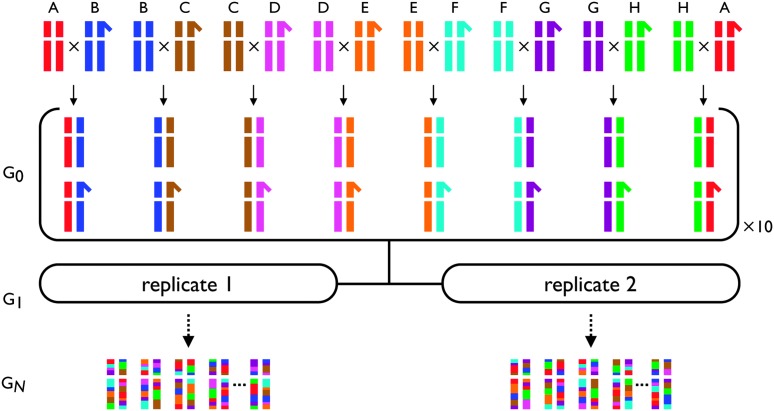
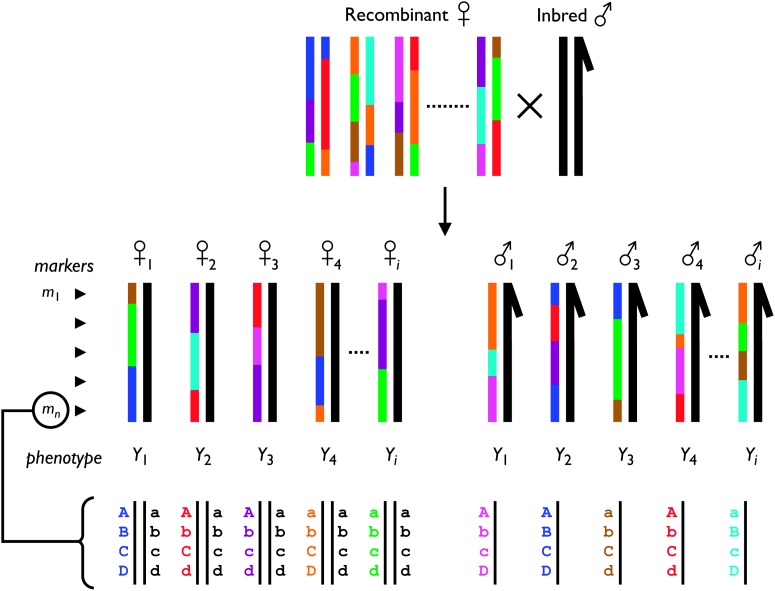
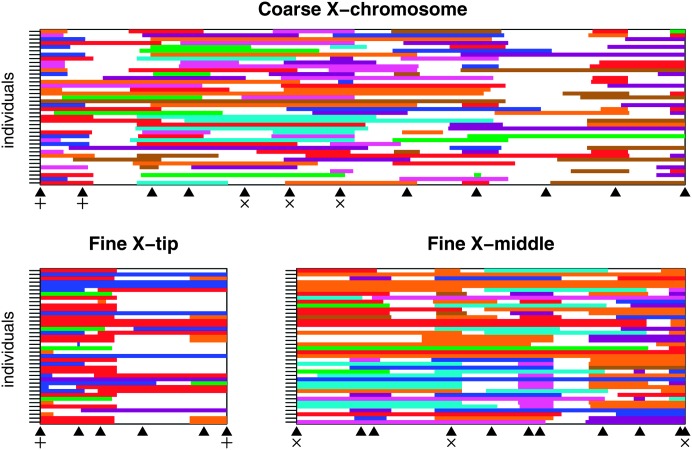
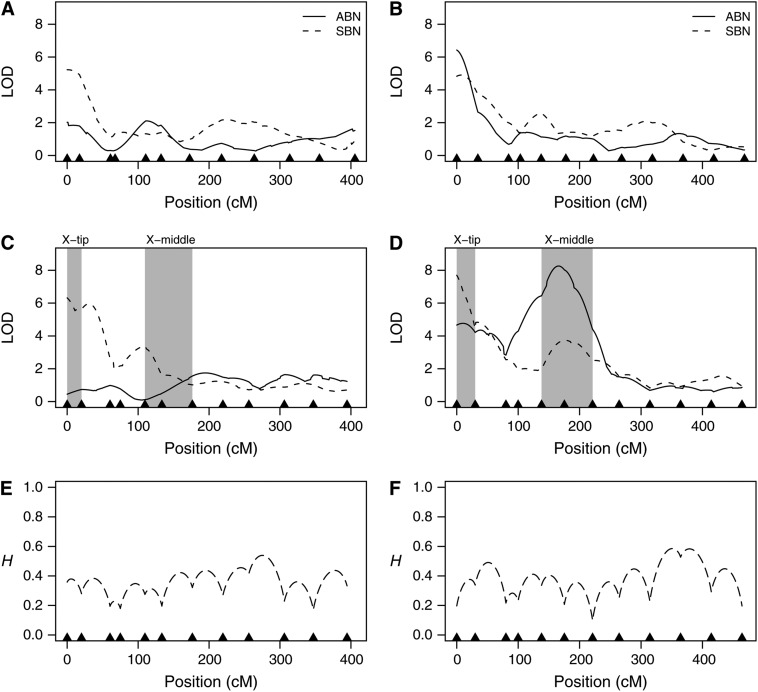
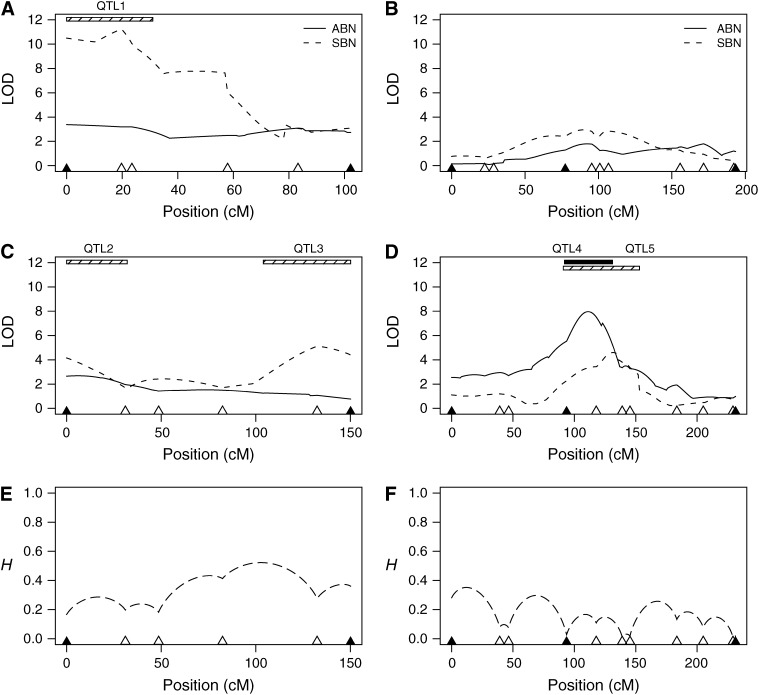
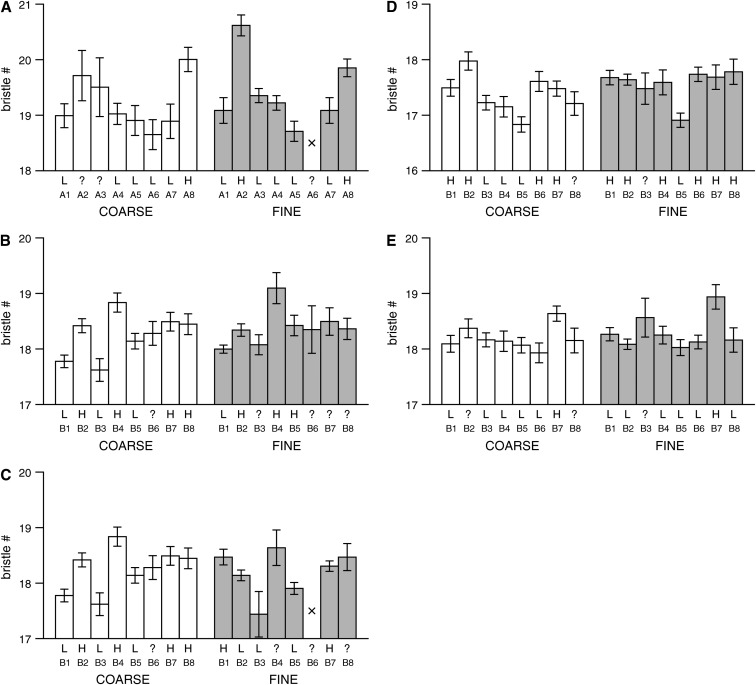
We develop and implement a strategy to map QTL in two synthetic populations of Drosophila melanogaster each initiated with eight inbred founder strains. These recombinant populations allow simultaneous estimates of QTL location, effect, and frequency. Five X-linked QTL influencing bristle number were resolved to intervals of approximately 1.3 cM. We confirm previous observations of bristle number QTL distal to 4A at the tip of the chromosome and identify two novel QTL in 7F-8C, an interval that does not include any classic bristle number candidate genes. If QTL at the tip of the X are biallelic they appear to be intermediate in frequency, although there is evidence that these QTL may reside in multiallelic haplotypes. Conversely, the two QTL mapping to the middle of the X chromosome are likely rare: in each case the minor allele is observed in only 1 of the 16 founders. Assuming additivity and biallelism we estimate that identified QTL contribute 1.0 and 8.7%, respectively, to total phenotypic variation in male abdominal and sternopleural bristle number in nature. Models that seek to explain the maintenance of genetic variation make different predictions about the population frequency of QTL alleles. Thus, mapping QTL in eight-way recombinant populations can distinguish between these models.


Figures

F<sc>igure</sc> 1.—
Figure 1.—
Creation of the synthetic recombinant D. melanogaster populations. A recombinant mapping population is initiated from a set of eight inbred lines, A–H, that are intercrossed (virgin females crossed to males) in a one-way round-robin design: line A crossed to line B, line B crossed to line C, …, and line H crossed to line A. From each of the eight crosses, 10 male and 10 virgin female F1 progeny were collected, pooled, and used to initiate the two replicate synthetic recombinant populations. Only the sex chromosomes and one set of autosomes are presented. Full details of the precise crosses performed are provided in the materials and methods.
F<sc>igure</sc> 2.—
Figure 2.—
Overview of the experimental strategy. Virgin females from the synthetic D. melanogaster mapping population (colored mosaic chromosomes) are crossed to males of the isogenic strain of D. melanogaster used for genome sequencing (uniform black chromosomes). All F1 progeny from this cross are trans-heterozygotes of a maternally inherited synthetic recombinant chromosome against a paternally inherited chromosome from the isogenic strain. Male F1 are hemizygous for the recombinant X chromosome. F1 trans-heterozygotes are each phenotyped for the trait of interest and genotyped for a set of molecular markers spanning the chromosome(s). As shown, a marker represents a multilocus genotype from a set of nonrecombining SNPs (four in this example). Markers allow the eight lines founding the recombinant population to be distinguished. Only the sex chromosomes are presented in this figure—autosomes would behave similarly to female X chromosomes.
F<sc>igure</sc> 3.—
Figure 3.—
Visual representation of genotyping information. Each row of each plot represents a single experimental male, for which the X chromosome is derived from the pBr1 synthetic recombinant population. The top plot shows 40 flies from the coarse-mapping sample for the entire X chromosome, and the bottom two plots show 40 flies from the two small fine-mapped regions of the X chromosome. For each male, every 1 cM (on the expanded genetic map) across the mapped region we examine the probability that the segment of chromosome is derived from each of the eight possible founder lines. If the probability for any one founder is >0.75, the position is colored according to the founder (colors are as in Figures 1 and 2); otherwise the position is white. Marker positions are shown beneath each plot as solid triangles. Markers used for both the coarse mapping and the X-tip fine mapping are indicated with plus symbols (+), while markers used for both coarse mapping and the X-middle fine mapping are indicated with cross symbols (×).
F<sc>igure</sc> 4.—
Figure 4.—
Coarse-mapping bristle number across the X chromosome. pAr1, experimental flies have recombinant chromosomes derived from synthetic population pAr1. pBr1+2, experimental flies with recombinant chromosomes derived from synthetic populations pBr1 or pBr2 were pooled prior to analysis. (A) pAr1 female LOD; (B) pBr1+2 female LOD; (C) pAr1 male LOD; (D) pBr1+2 male LOD; (E) genotype information (pAr1 male); (F) genotype information (pBr1+2 male). (A–D) Likelihood profiles. Each curve shows the likelihood that a given region of the chromosome harbors a QTL for bristle number (solid curves, ABN; dashed curves, SBN). Marker positions are shown as solid triangles along the x-axis. LOD scores are plotted against position (in centimorgans) on the expanded genetic map. The expansion is due to the large number of meiotic recombination events the synthetic population was subjected to prior to mapping. Note that the genetic map positions are not identical across the four plots. Vertical shaded bars represent regions used for fine mapping (Figure 5). (E and F) Missing genotypic information. The proportion of missing genotypic information, H, is plotted against the expanded genetic map position. H = 0, no missing information; H = 1, no information; described fully in the materials and methods. For population pAr1 (E) and the pooled pBr1+2 population (F), missing information is provided only for the experimental males. Missing data from females are very similar.
F<sc>igure</sc> 5.—
Figure 5.—
Fine-mapping bristle number in two small regions of the X chromosome. pAr1 (pBr1) indicates the synthetic population from which the recombinant chromosomes of the experimental flies are derived. X-tip and X-middle refer to the regions of the X chromosome showing evidence for a QTL in the coarse-mapping study and represent those regions of the chromosome shaded in Figure 4. (A) X-tip, pAr1 male LOD; (B) X-middle, pAr1 male LOD; (C) X-tip, pBr1 male LOD; (D) X-middle, pBr1 male LOD; (E) X-tip, genotype information (pBr1); (F) X-middle, genotype information (pBr1). (A–D) Likelihood profiles. Each curve shows the likelihood that a given region of the chromosome harbors a QTL for bristle number (solid curves, ABN; dashed curves, SBN). Marker positions are shown as triangles along the x-axis (solid triangles, markers used in coarse mapping [Figure 4]; open triangles, markers used only for fine mapping). LOD scores are plotted against position (in centimorgans) on an expanded genetic map. Note that the genetic map positions are not identical across the four plots. Bars at the top of the plots represent 2.5-LOD drop intervals across five fine-mapped QTL (solid bar, QTL for ABN; hatched bar, QTL for SBN). (E and F) Missing genotypic information. The proportion of missing genotypic information, H, is plotted against the expanded genetic map position. H = 0, no missing information; H = 1, no information—described fully in the materials and methods. For the X-tip region (E) and the X-middle region (F), missing information is provided only for flies derived from population pBr1. Missing data from pAr1 flies are very similar.
F<sc>igure</sc> 6.—
Figure 6.—
Estimated phenotypic means for each of the founder chromosomes at QTL. Each plot represents a single male bristle number QTL (see Figure 5 and Tables 4 and 5 for details) and shows the estimated phenotypic mean (standard error) at the QTL peak for each of the eight lines used to found the particular synthetic population. The line numbers, A1–A8 and B1–B8, refer to the lines described in Table 1. For comparison the means estimated at the QTL peak are presented for both the coarse- (open bars) and fine-mapping (shaded bars) panels. Bars are presented only if the estimated number of experimental individuals consistent with having a given founder chromosome is >10; otherwise a cross is plotted. Below the bars we give the most probable QTL allele harbored by the founder (L, low allele; H, high allele), under the assumption that the QTL is biallelic. If the founder cannot be confidently (probability > 0.95) assigned an allele, a ? is applied. (A) QTL1 for pA male SBN mapped to the X-tip region in population pAr1, (B) QTL2 for pB male SBN mapped to the X-tip region in pBr1+2 (coarse mapping) and pBr1 (fine mapping), and (C) QTL3 for pB male SBN mapped to the X-tip region in pBr1+2 (coarse mapping) and pBr1 (fine mapping). The coarse-mapping information for QTL2 and QTL3 is identical, as these are the two fine-mapped QTL we detected under a single coarse-mapped peak. (D) QTL4 for pB male ABN mapped to the X-middle region in pBr1+2 (coarse mapping) and pBr1 (fine mapping), and (E) QTL5 for pB male SBN mapped to the X-middle region in pBr1+2 (coarse mapping) and pBr1 (fine mapping).

Similar articles

Cited by

References

    1. Adams, M. D., S. E. Celniker, R. A. Holt, C. A. Evans, J. D. Gocayne et al., 2000. The genome sequence of Drosophila melanogaster. Science 287 2185–2195. - PubMed
    1. Aguadé, M., N. Miyashita and C. H. Langley, 1989. Reduced variation in the yellow–achaete–scute region in natural populations of Drosophila melanogaster. Genetics 122 607–615. - PMC - PubMed
    1. Artavanis-Tsakonas, S., M. D. Rand and R. J. Lake, 1999. Notch signaling: cell fate control and signal integration in development. Science 284 770–776. - PubMed
    1. Barton, N. H., and M. Turelli, 1989. Evolutionary quantitative genetics: How little do we know? Annu. Rev. Genet. 23 337–370. - PubMed
    1. Barton, N. H., and P. D. Keightley, 2002. Understanding quantitative genetic variation. Nat. Rev. Genet. 3 11–21. - PubMed

Publication types

Associated data

LinkOut - more resources