. 2007 Jun;176(2):1059-88.
doi: 10.1534/genetics.106.065979. Epub 2007 Apr 15.

Asymmetric postmating isolation: Darwin's corollary to Haldane's rule

Affiliations

Asymmetric postmating isolation: Darwin's corollary to Haldane's rule

Michael Turelli et al. Genetics. 2007 Jun.

Abstract

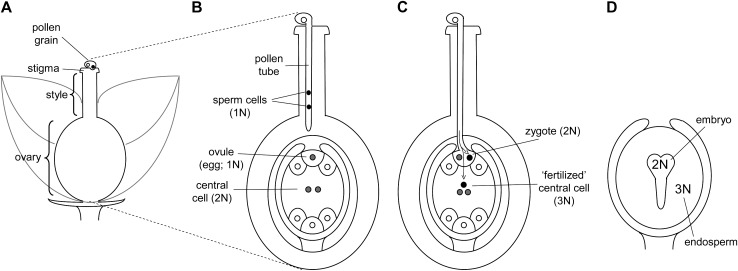
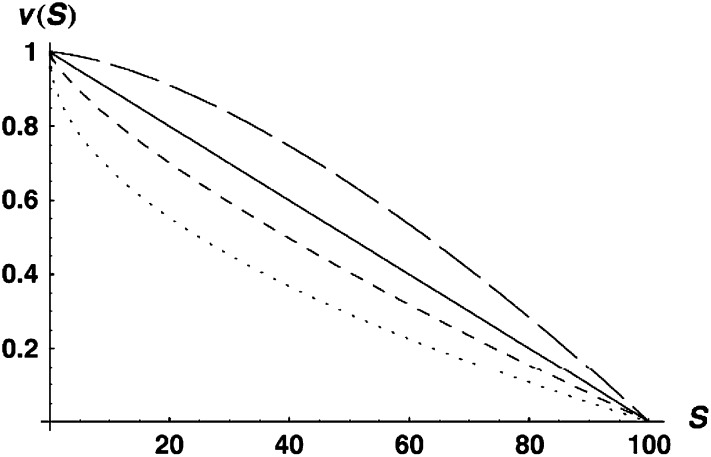
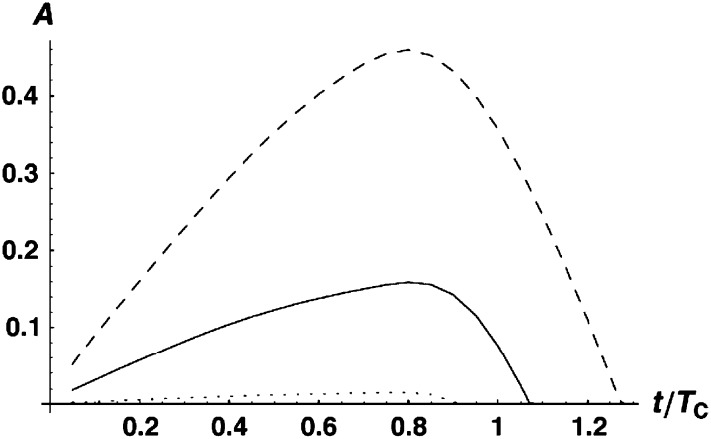
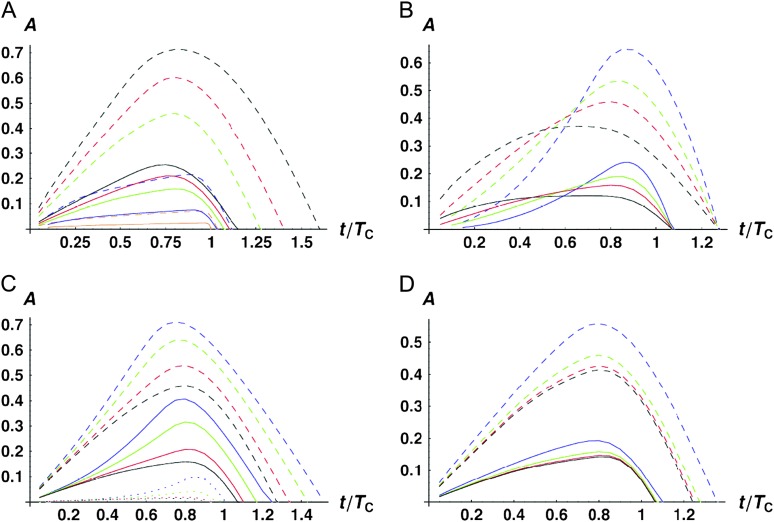
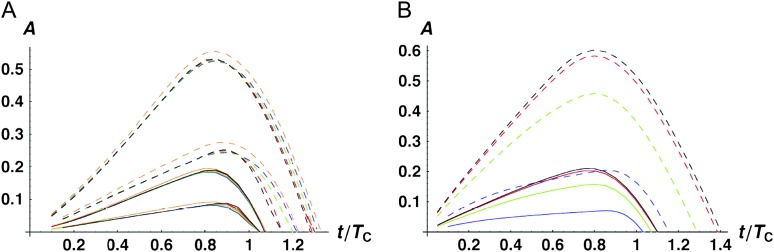
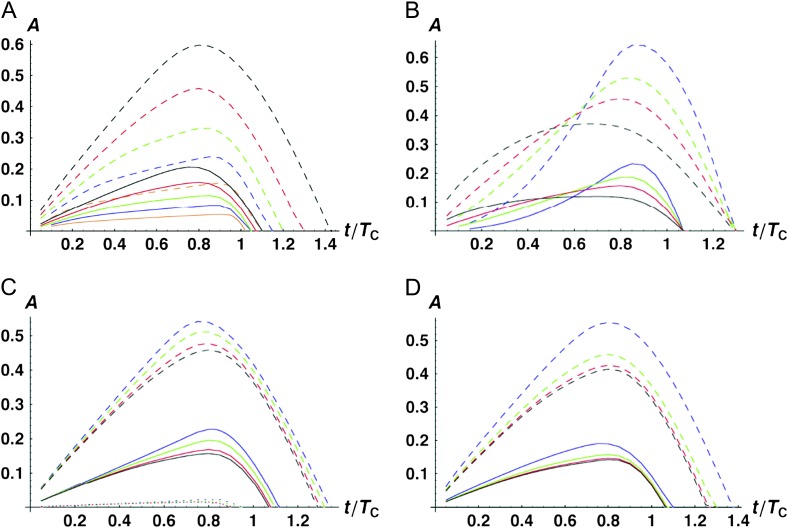
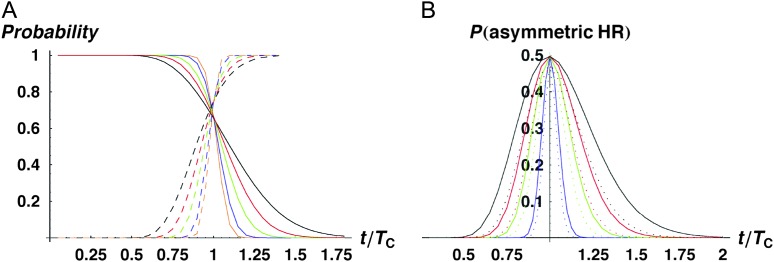
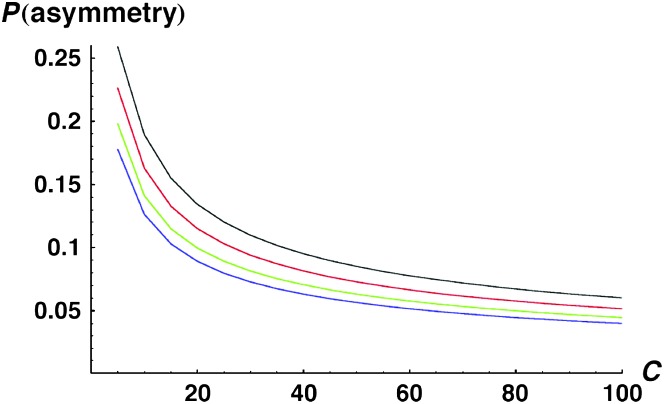
Asymmetric postmating isolation, where reciprocal interspecific crosses produce different levels of fertilization success or hybrid sterility/inviability, is very common. Darwin emphasized its pervasiveness in plants, but it occurs in all taxa assayed. This asymmetry often results from Dobzhansky-Muller incompatibilities (DMIs) involving uniparentally inherited genetic factors (e.g., gametophyte-sporophyte interactions in plants or cytoplasmic-nuclear interactions). Typically, unidirectional (U) DMIs act simultaneously with bidirectional (B) DMIs between autosomal loci that affect reciprocal crosses equally. We model both classes of two-locus DMIs to make quantitative and qualitative predictions concerning patterns of isolation asymmetry in parental species crosses and in the hybrid F(1) generation. First, we find conditions that produce expected differences. Second, we present a stochastic analysis of DMI accumulation to predict probable levels of asymmetry as divergence time increases. We find that systematic interspecific differences in relative rates of evolution for autosomal vs. nonautosomal loci can lead to different expected F(1) fitnesses from reciprocal crosses, but asymmetries are more simply explained by stochastic differences in the accumulation of U DMIs. The magnitude of asymmetry depends primarily on the cumulative effects of U vs. B DMIs (which depend on heterozygous effects of DMIs), the average number of DMIs required to produce complete reproductive isolation (more asymmetry occurs when fewer DMIs are required), and the shape of the function describing how fitness declines as DMIs accumulate. Comparing our predictions to data from diverse taxa indicates that unidirectional DMIs, specifically involving sex chromosomes, cytoplasmic elements, and maternal effects, are likely to play an important role in postmating isolation.


Figures

F<sc>igure</sc> 1.—
Figure 1.—
Generalized angiosperm gametogenesis and double fertilization. (A) During pollination pollen is transferred to the stigma of the recipient flower. (B) During fertilization the pollen tube germinates and travels through the female stigmatic tissue into the ovary. The mature male gamete (pollen or “microgametophyte”) comprises two genetically identical haploid sperm cells that result from the mitotic division of a single meiotic product. The mature female gametophyte comprises eight genetically identical haploid nuclei resulting from mitotic division of a single meiotic product. The “central cell” differs from the haploid ovule (1N) and other cells in that it is binucleate (2N). (C) Double fertilization: One haploid sperm cell fertilizes the ovule, while the other sperm cell fuses with the diploid central cell to form a triploid endosperm. (D) Postfertilization development: The triploid endosperm functions as a primary storage and nutritive tissue for the developing embryo.
F<sc>igure</sc> 2.—
Figure 2.—
The fitness function v(S) described by (10) with C = 100 and α = 0.5 (dotted curve), 0.75 (short-dashed curve), 1.0 (solid curve), and 1.5 (long-dashed curve).
F<sc>igure</sc> 3.—
Figure 3.—
Time-dependent quantiles of A, our measure of quantitative asymmetry defined in Equation 11 [i.e., P(Aa) = P] for C = 20, α = 0.75, δ1 = 0, and CV = 0.5, with P = 0.05 (dotted curve), 0.5 (solid curve), and 0.95 (dashed curve).
F<sc>igure</sc> 4.—
Figure 4.—
Time-dependent medians (solid curves) and 95th percentiles (dashed curves) of asymmetry values A [i.e., P(Aa) = 0.5 vs. 0.95] when only U DMIs contribute to reproductive isolation between lineages. (A) The effects of varying C with α = 0.75, δ1 = 0, and CV = 0.5. The curves are C = 5 (black), 10 (red), 20 (green), 100 (blue), and 1000 (orange). (B) The effects of varying α with C = 20, CV = 0.5, and δ1 = 0. The curves are α = 0.5 (black), 0.75 (red), 1 (green), and 1.5 (blue). (C) The effects of varying δ1 (which controls expected differences between reciprocal breakdown scores) with C = 20, α = 0.75, and CV = 0.5. The curves are δ1 = 0 [E(S12) = E(S21), black], δ1 = 0.166667 (υ1 = 2υ2, red), δ1 = 0.3 (υ1 = 4υ2, green), and δ1 = 0.4 (υ1 = 9υ2, blue). In addition to the median and the 95th percentiles, the 5th percentiles are shown as dotted curves. (D) The effects of varying CV with C = 20, α = 0.75, and δ1 = 0. The curves are CV = 0 (black), 0.25 (red), 0.5 (green), and 1.0 (blue).
F<sc>igure</sc> 5.—
Figure 5.—
Effects of combining symmetric (B) and asymmetric (U) DMIs on the time-dependent asymmetry values, A. The solid lines are medians, the dashed lines are 95th percentiles. (A) The effect of varying the dominance parameter h0, while holding fixed the parameter η, defined in (26), which quantifies the relative contribution of B vs. U DMIs to hybrid dysfunction. Two sets of results are provided: η = 1 (top) and η = 10 (bottom). The curves are h0 = 0.05 (black), 0.1 (red), 0.2 (green), 0.3 (blue), and 0.4 (orange). The other parameters are C = 10, α = 0.75, δ1 = 0, and CV = 0.5. (B) The effect of varying the mix of symmetric (B) vs. asymmetric (U) DMIs, as measured by η. The curves are η = 0 (all U, black), η = 0.1 (red), η = 1 (green), and η = 10 (blue). The other parameters are h0 = 0.1, C = 10, α = 0.75, δ1 = 0, and CV = 0.5.
F<sc>igure</sc> 6.—
Figure 6.—
Time-dependent medians (solid curves) and 95th percentiles (dashed curves) for the asymmetry index A [i.e., P(Aa) = 0.5 vs. 0.95] when both U and B DMIs contribute to reproductive isolation between lineages. (A) The effects of varying C with η = 1, h0 = 0.1, α = 0.75, δ1 = 0, and CV = 0.5. The curves are C = 5 (black), 10 (red), 20 (green), 40 (blue), and 100 (orange). (B) The effects of varying α, the shape of the fitness function, with C =10, η = 1, h0 = 0.1, δ1 = 0, and CV = 0.5. The curves are α = 0.5 (black), 0.75 (red), 1 (green), and 1.5 (blue). (C) The effects of varying δ1 (which controls expected differences between reciprocal breakdown scores) with C =10, η = 1, h0 = 0.1, α = 0.75, and CV = 0.5. The curves are δ1 = 0 [E(S12) = E(S21), black], δ1 = 0.166667 (υ1 = 2υ2, red), δ1 = 0.3 (υ1 = 4υ2, green), and δ1 = 0.4 (υ1 = 9υ2, blue). In addition to the median and the 95th percentiles, the 5th percentiles are shown as dotted curves. (D) The effects of varying CV with C = 20, α = 0.75, and δ1 = 0. The curves are CV = 0 (black), 0.25 (red), 0.5 (green), and 1.0 (blue).
F<sc>igure</sc> 7.—
Figure 7.—
Time-dependent values of probabilities related to qualitative asymmetry between reciprocal crosses. (A and B) The effect of varying C with gU = 0.2, h0 = 0.1, α = 0.75, δ1 = 0, CV = 0.5, and p/pU adjusted to produce the desired value of η. The colors indicate C = 5 (black), 10 (red), 20 (green), 50 (blue), and 100 (orange). (A) Assumes η = 0.5 and shows the effect of varying C on the conditional probability of qualitative asymmetry given that postmating isolation is complete in one of the two reciprocal crosses (P[Smin < C | Smax > C], solid curves) and the probability that postmating isolation is complete in at least one direction (P[Smax > C], dashed curves). (B) The joint probability that Smax > C and Smin < C as t varies with η = 0.1 (solid curves) and η = 1.0 (dotted curves).
F<sc>igure</sc> 8.—
Figure 8.—
Approximate probabilities of qualitative asymmetry as a function of C, calculated using (30) with T1 = 0.5TC and T2 = 1.5TC. The parameters are the same as in Figure 7, and the curves correspond to η = 0.1 (black), η = 0.5 (red), η = 1.0 (green), and η = 1.5 (blue).
F<sc>igure</sc> 9.—
Figure 9.—
Quantitative asymmetry, A, from crosses between centrarchid fishes with a fossil-calibrated phylogeny [adapted from Bolnick and Near's (2005) Figure 4, with corrections provided by D. I. Bolnick]. The data from each cross describe the mean hatch rate for hybrids divided by the mean hatch rate from intraspecific crosses. The y-axis is the difference between reciprocal crosses, and the x-axis is estimated divergence time in millions of years.
F<sc>igure</sc> 10.—
Figure 10.—
Changes in isolation asymmetry over time in Silene species crosses at the stage of pollen–stigma (GS) interactions (A) and interactions during endosperm (TRE) and seed development (B).
F<sc>igure</sc> A1.—
Figure A1.—
Comparison between numerical predictions for quantitative asymmetry, A, based on our bivariate Gaussian approximation and Equation 12 (dashed curves) and simulation results of a compound Poisson process (dots) as described in appendix b. The colors correspond to 95th (red), 50th (green), and 5th (blue) percentiles of A. Our calculations assume only U DMIs with C = 20, α = 0.75, δ1 = 0 and CV = 0.5.

References

    1. Arnold, S. J., P. A. Verrell and S. G. Tilley, 1996. The evolution of asymmetry in sexual isolation: a model and test case. Evolution 50 1024–1033. - PubMed
    1. Barbash, D. A., D. F. Siino, A. M. Tarone and J. Roote, 2003. A rapidly evolving MYB-related protein causes species isolating in Drosophila. Proc. Natl. Acad. Sci. USA 100 5302–5307. - PMC - PubMed
    1. Bateson, W., 1901. Experiments in plant hybridization. J. R. Hortic. Soc. 26 1–32.
    1. Berlin, S., and H. Ellegren, 2006. Fast accumulation of nonsynonymous mutations on the female-specific W chromosome in birds. J. Mol. Evol. 62 66–72. - PubMed
    1. Bernacchi, D., and S. D. Tanksley, 1997. An interspecific backcross of Lycopersicon esculentum × L. hirsutum: linkage analysis and a QTL study of sexual compatibility factors and floral traits. Genetics 147 861–877. - PMC - PubMed

Publication types