. 2007 Jun;176(2):927-36.
doi: 10.1534/genetics.107.072074. Epub 2007 Apr 15.

Involvement of the mitochondrial protein translocator component tim50 in growth, cell proliferation and the modulation of respiration in Drosophila

Affiliations

Involvement of the mitochondrial protein translocator component tim50 in growth, cell proliferation and the modulation of respiration in Drosophila

Shin Sugiyama et al. Genetics. 2007 Jun.

Abstract

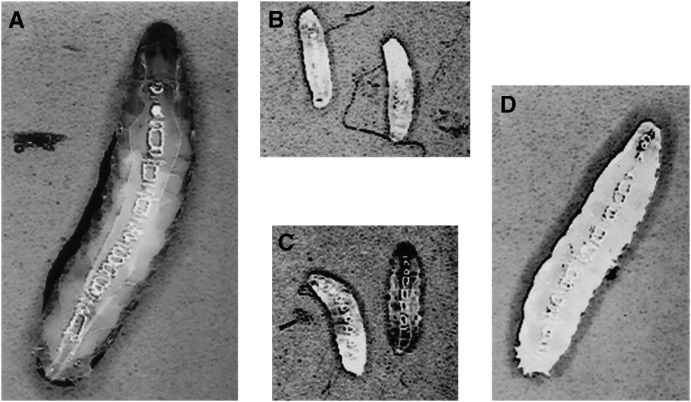
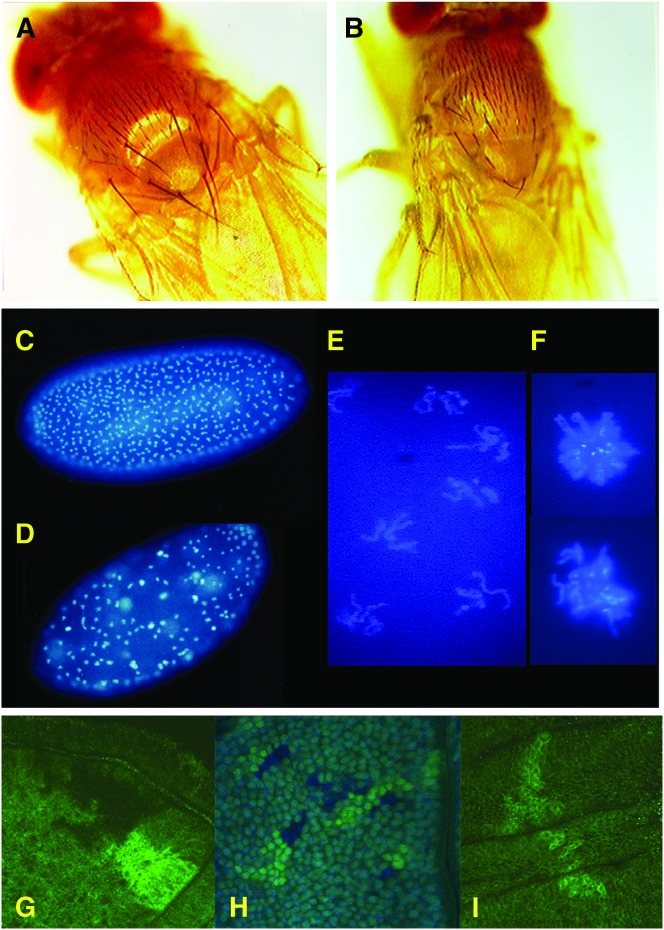
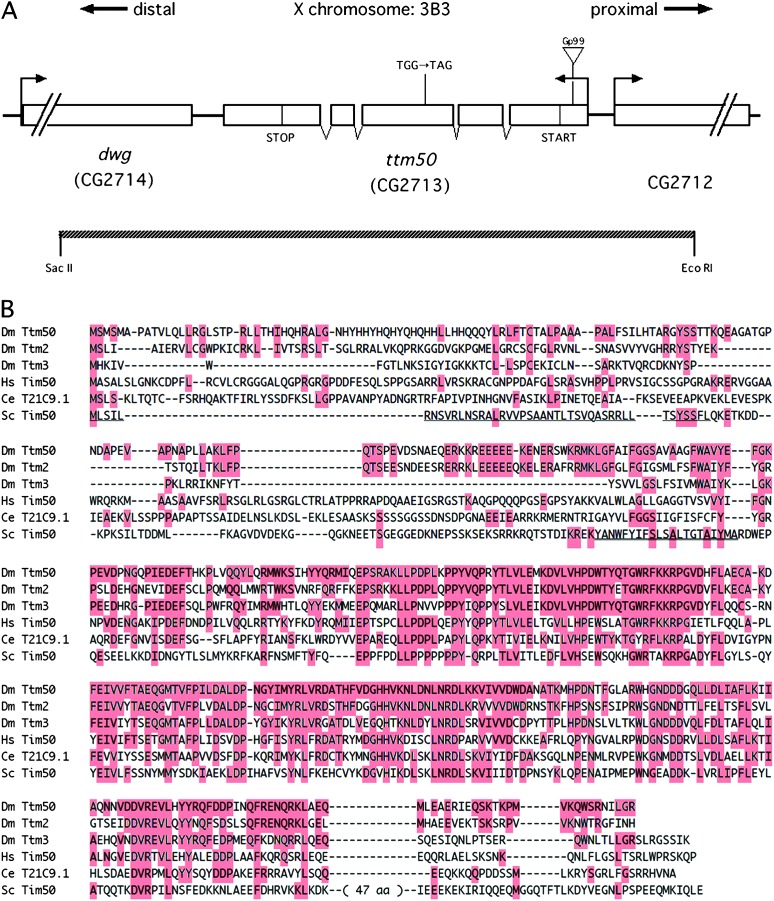
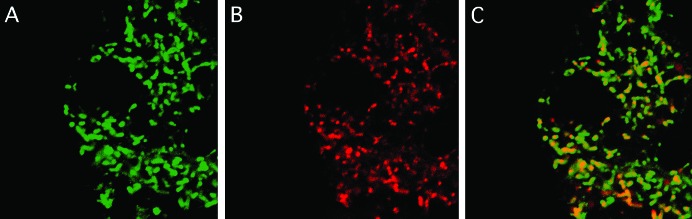
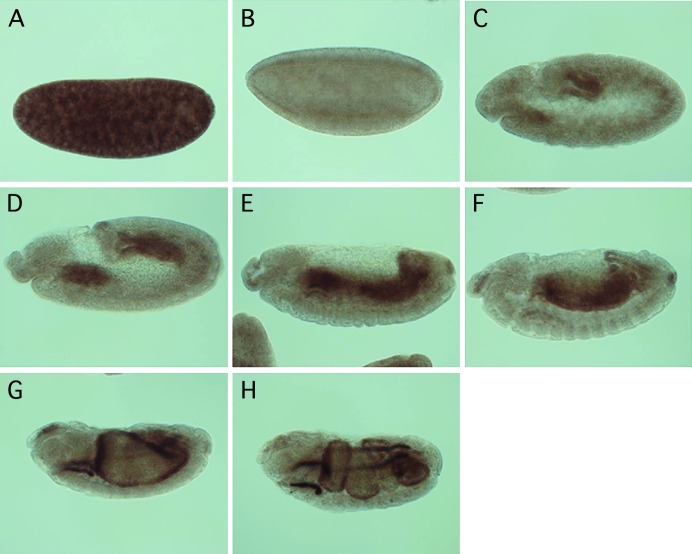
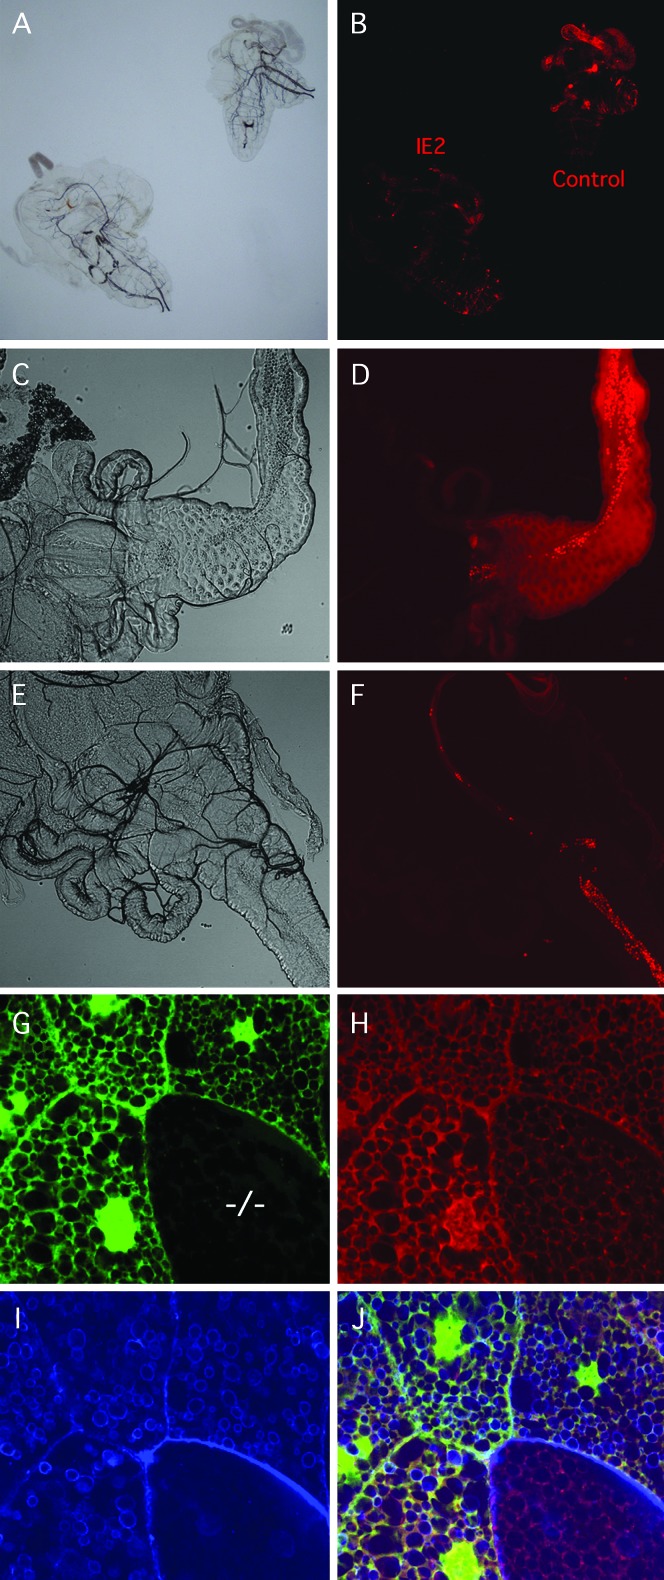
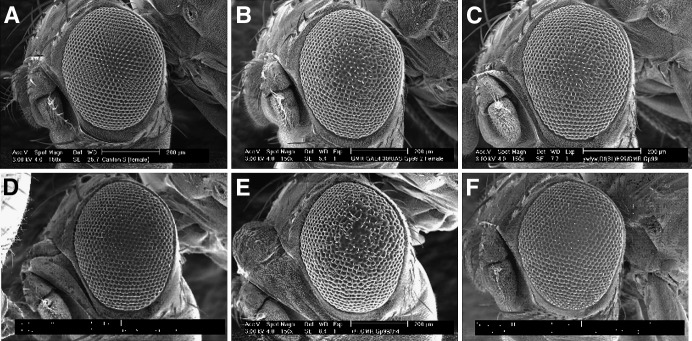
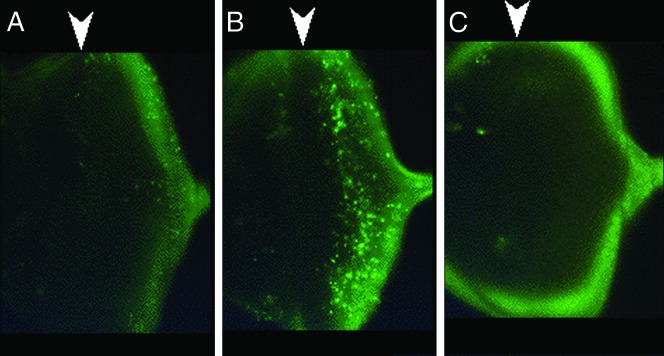
Allelic mutants exhibiting growth defects in Drosophila were isolated. Molecular cloning identified the responsible gene as a budding yeast Tim50 ortholog, and thus it was named tiny tim 50 (ttm50). The weak allele (ttm50(Gp99)) produced small flies due to reduced cell size and number, and growth terminated at the larval stage in the strong alleles (ttm50(IE1) and ttm50(IE2)). Twin-spot analysis showed fewer cells in ttm50(Gp99) clones, whereas ttm50(IE1) clones did not proliferate, suggesting that the gene has an essential cellular function. Tim50 is known to maintain mitochondrial membrane potential (MMP) while facilitating inner-membrane protein transport. We found that tagged Ttm50 also localized to mitochondria and that mitochondrial morphology and MMP were affected in mutants, indicating that mitochondrial dysfunction causes the developmental phenotype. Conversely, ttm50 overexpression increased MMP and apoptosis. Co-expression of p35 suppressed this apoptosis, resulting in cell overproliferation. Interestingly, ttm50 transcription was tissue specific, corresponding to elevated MMP in the larval midgut, which was decreased in the mutant. The correlation of ttm50 expression levels with differences in MMP match its proposed role in mitochondrial permeability barrier maintenance. Thus a mitochondrial protein translocase component can play active roles in regulating metabolic levels, possibly for modulation of physiological function or growth in development.


Figures

F<sc>igure</sc> 1.—
Figure 1.—
Growth defects observed in ttm50 mutant larvae. (A) A wild-type embryo at 4 days after hatching is fully grown and ready to pupate. (B) ttm50IE1 null allele and (C) ttm50IE2 strong allele larvae are much smaller at the same age and later die without showing significant increase in size. (D) A ttm50Gp99 hypomorphic allele larvae at the same age shows a smaller body size, requiring a few more days to pupate. All photos at same magnification.
F<sc>igure</sc> 2.—
Figure 2.—
The ttm50Gp99 hypomorphic allele shows growth and cell cycle defects. (A) A yellow1 (y1) adult male control fly showing normal body size and bristle morphology. (B) A y1 ttm50Gp99 hemizygote male showing reduced body size and underdeveloped macrochaetae. (C) A DAPI-stained wild-type cleavage-stage embryo showing uniform distribution of nuclei in synchronous mitosis. (D) A DAPI-stained y1 ttm50Gp99 homozygous female-derived embryo showing irregular distribution of cleavage nuclei, with some showing stronger staining intensity. (E) Higher magnification image of typical nuclei in D shows condensed chromosomes in early mitosis. (F) Higher magnification image of nuclei with stronger staining intensity in D shows condensed polyploid chromosomes, which appear to have failed in nuclear division. (G) Mitotic sister (bright and dark) clones of wild-type cells are of similar size. (H) Mitotic clones of ttm50Gp99 homozygous cells (dark-blue nuclei) have fewer cells than their wild-type (ubi-GFP/ubi-GFP) sister clones (bright-green nuclei) when induced in a heterozygous (ttm50Gp99/ubi-GFP) background (pale green nuclei). (I) Only the control sister clones of ttm50IE1 null clones are observed, even after extensive growth.
F<sc>igure</sc> 3.—
Figure 3.—
Molecular characterization of the ttm50 loci and its conservation through evolution. (A) The ttm50 locus and the intron/exon organization of its transcript. The ORF is indicated by START and STOP. The ttm50Gp99 allele is caused by a P-element-insertion in the 5′-UTR. The ttm50IE1 allele is caused by a nucleotide alteration of Trp197 to a TAG termination codon. The extent of the 3.5-kb SacII/EcoRI fragment used for rescue transgene constructs is indicated. (B) Amino acid sequence comparison of genes sharing homology to ttm50. Amino acid residues identical to those of Dm Ttm50 are highlighted and gaps are indicated by dashes. Dm Ttm50, D. melanogaster Tiny tim50; Dm Ttm2, D. melanogaster Tiny tim2; Dm Ttm3, D. melanogaster Tiny tim3; HsTim50, Homo sapiens Tim50; Ce T21C9.1; C. elegans T21C9.1; Sc Tim50, Saccharomyces cerevisiae Tim50. The thin underline in S. cerevisiae Tim50 indicates the mitochondria-targeting presequence and the thick underline indicates the transmembrane domain.
F<sc>igure</sc> 4.—
Figure 4.—
HA-tagged Ttm50 localizes to the mitochondria. (A) Highly magnified confocal image of a fat-body cell. The open area in the center corresponds to the nuclei. The HA-tagged Ttm50 protein staining appears as reticulated structures in the cytoplasm. (B) Mitochondria stained by Mitotracker Red. (C) Merged image shows a good overlap (yellow), although the distribution of intensity within the mitrochondria differs.
F<sc>igure</sc> 5.—
Figure 5.—
Expression of ttm50 transcripts is developmentally regulated during embryogenesis. In situ hybridization with antisense RNA probes was used to study the tissue specificity of ttm50 transcription at various embryonic stages. (A) Transcripts were ubiquitously distributed during the cleavage stage and are presumably maternally derived. (B) Transcripts temporarily disappeared at the cellular blastoderm stage. (C and D) Expression reappeared in the midgut primordial and weakly in the mesoderm of gastrulas. (E and F) Additional transcripts appeared in the hindgut and Malpighian tubules during germband retraction. The mesodermal expression could be seen in the differentiating skeletal and visceral muscles. (G and H) This expression pattern was retained throughout the duration of organogenesis. In all photos, anterior is to the left and dorsal to the top.
F<sc>igure</sc> 6.—
Figure 6.—
Strong alleles of ttm50 show reduced mitochondrial activity. (A) Bright-field image of ttm50IE2 (left) and wild-type (right) larvae partially dissected and incubated in PBS containing 10 ng/ml Mitotracker Red. (B) Fluorescent image of same sample shows weaker respiration-dependent staining in the mutant. Staining is strongest in the wild-type gut. (C) Bright-field image of proventriculus and anterior midgut of wild-type second instar larva. (D) Mitotracker-Red-stained fluorescent image of same sample. Bright red spots are stained yeast in the alimentary tract. (E) Bright-field image of the same organs in a ttm50IE2 larva. (F) Mitotracker Red staining is reduced in mutant. (G) Homozygous ttm50IE1 mutant clone cells were induced in heterozygous embryos by X-ray irradiation and examined in third instar larva. Mutant salivary gland cell (−/−) is identified by reduced GFP fluorescence. (H) Mitotracker Red staining in mutant cell is reduced in both intensity and area. (I) Alexa Fluor 647-conjugated phalloidin staining reveals accumulation of actin at cell periphery and reduction in actin around vesicle-like structures of mutant cell. (J) Merged image of G–I.
F<sc>igure</sc> 7.—
Figure 7.—
Overexpression of ttm50 in the compound eye causes extra proliferation of cells. (A) Scanning electron micrograph of wild-type eye. The number of ommatidia was 752.5 ± 23.5 (n = 13). (B) Rough-eye phenotype caused by overexpression of ttm50 under the control of the glass-mediated response element. (C) Suppression of rough-eye phenotype by a reduction by half in the gene dosage of hid grim reaper using the Df(3R)H99. (D) Suppression of rough-eye phenotype by a reduction by half in the gene dosage of hid alone. (E) Enhancement of rough-eye phenotype by a reduction by half in the gene dosage of DIAP. (F) Suppression of rough-eye phenotype by the co-expression of the caspase inhibitor p35. The number of ommatidia increased (798.5 ± 11.6, n = 13) significantly compared to wild type. Expression of p35 alone did not affect ommatidial organization or number (754.0 ± 10.8, n = 6) compared to wild type.
F<sc>igure</sc> 8.—
Figure 8.—
Cell death is induced by overexpression of ttm50. (A) Normal levels of apoptosis detected in the eye imaginal disc by acridine orange. (B) Increased cell death induced by the GMR element mediated expression of ttm50 in the eye imaginal disc. Note that the induction occurs after the passage of (and to the right of) the morphogenetic furrow. (C) Almost complete suppression of apoptosis by the co-expression of p35. Arrowheads above each image indicate the position of the morphogenetic furrow.
F<sc>igure</sc> 9.—
Figure 9.—
Co-expression of UAS-ttm50 and UAS-p35 driven by en-GAL4 increases cell density (A–D) and proliferation (E and F) in the imaginal discs. (A) Wing disc nuclei stained by DAPI. (B) en-GAL4-driven gene expression in the posterior compartment marked by UAS-GFP. (C) Tissue morphology visualized by actin stained with Alexa Fluor 647-conjugated phalloidin shows a change in the posterior compartment. (D) Merged image of A–C. (E) en-GAL4-driven gene expression in the posterior compartments of two imaginal discs marked by UAS-GFP. (F) S-phase cells visualized by Brd-U incorporation increased in the posterior compartments. (G) Expression of UAS-GFP driven by ptc-GAL along the anterior posterior boundry of the wing imaginal disc pouch. (H) Increase in Mitotracker Red staining induced by overexpression of UAS-ttm50 driven by ptc-GAL in the same sample.

Similar articles

Cited by

References

    1. Böhni, R., J. Riesgo-Escovar, S. Oldham, W. Brogiolo, H. Stocker et al., 1999. Autonomous control of cell and organ size by CHICO, a Drosophila homolog of vertebrate IRS1–4. Cell 97 865–875. - PubMed
    1. Brand, A. H., and N. Perrimon, 1993. Targeted expression as a means of altering cell fates and generating dominant phenotypes. Development 118 401–415. - PubMed
    1. Brown, N. H., and F. C. Kafatos, 1988. Functional cDNA libraries from Drosophila embryos. J. Mol. Biol. 203 425–437. - PubMed
    1. Chen, C., J. Joseph and R. S. Garofalo, 1996. The Drosophila insulin receptor is required for normal growth. Endocrinology 137 846–856. - PubMed
    1. Curran, S, P., E. P. Leverich, C. M. Koehler and P. L. Larsen, 2004. Defective mitochondrial protein translocation precludes normal Caenorhabditis elegans development. J. Biol. Chem. 279 54655–54662. - PubMed

Publication types