. 2007 Jun;176(2):1197-208.
doi: 10.1534/genetics.107.071696. Epub 2007 Apr 15.

A Bayesian multilocus association method: allowing for higher-order interaction in association studies

Affiliations

A Bayesian multilocus association method: allowing for higher-order interaction in association studies

Anders Albrechtsen et al. Genetics. 2007 Jun.

Abstract

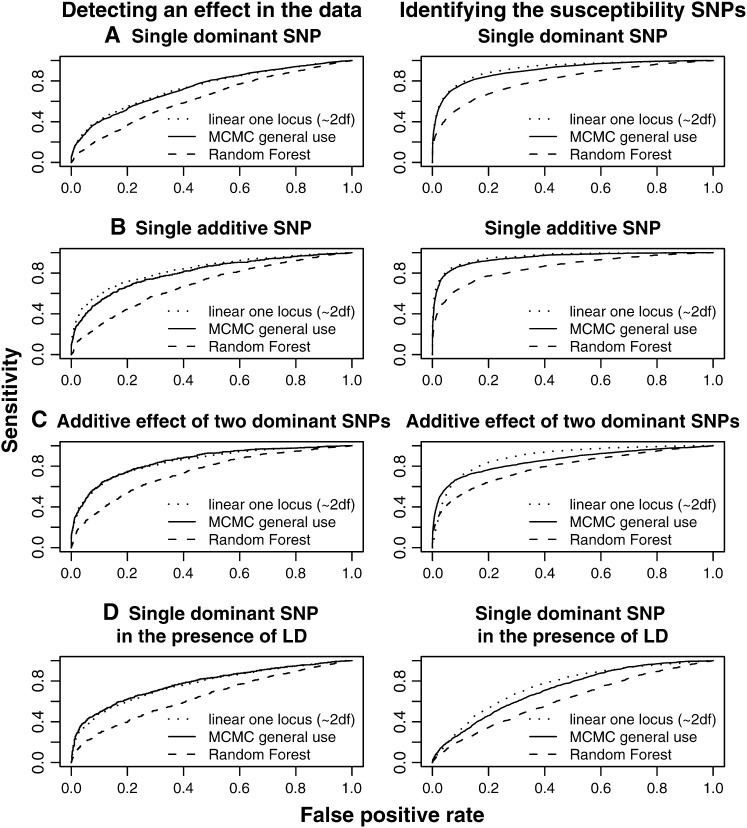
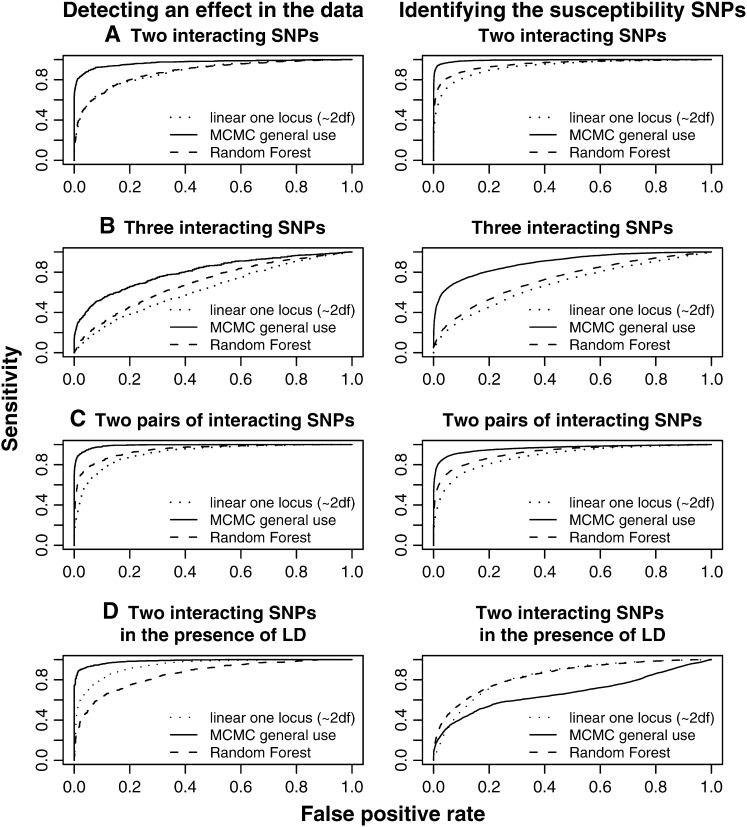
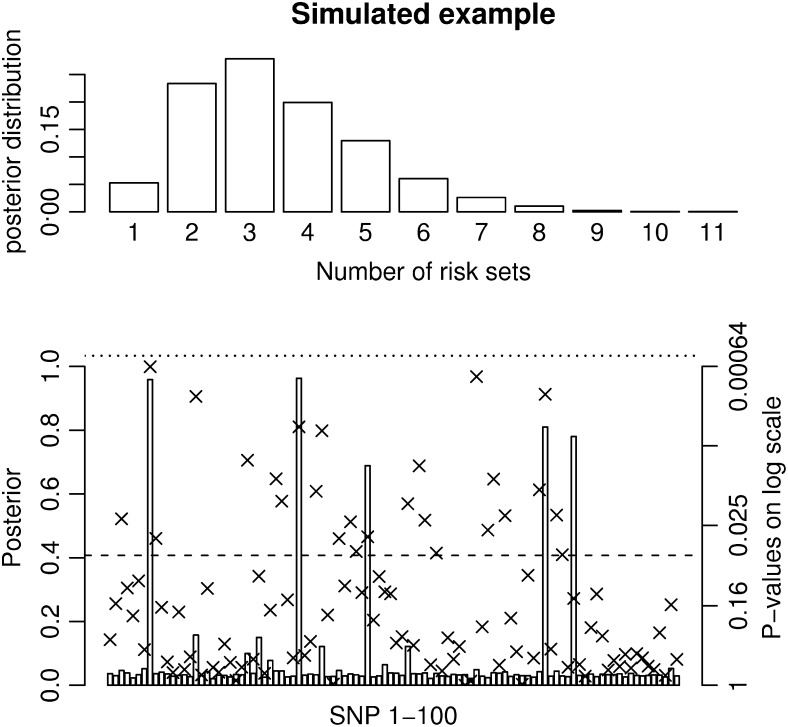
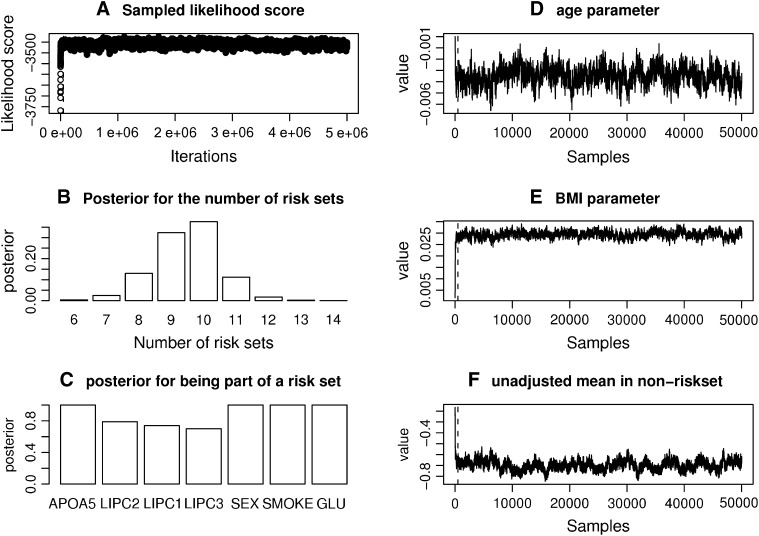
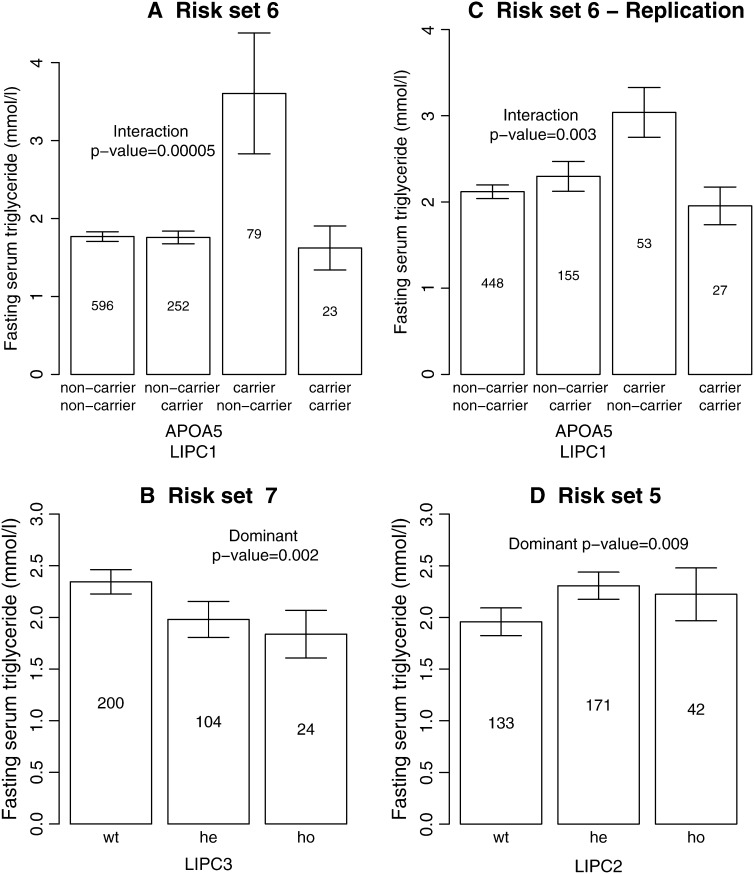
For most common diseases with heritable components, not a single or a few single-nucleotide polymorphisms (SNPs) explain most of the variance for these disorders. Instead, much of the variance may be caused by interactions (epistasis) among multiple SNPs or interactions with environmental conditions. We present a new powerful statistical model for analyzing and interpreting genomic data that influence multifactorial phenotypic traits with a complex and likely polygenic inheritance. The new method is based on Markov chain Monte Carlo (MCMC) and allows for identification of sets of SNPs and environmental factors that when combined increase disease risk or change the distribution of a quantitative trait. Using simulations, we show that the MCMC method can detect disease association when multiple, interacting SNPs are present in the data. When applying the method on real large-scale data from a Danish population-based cohort, multiple interactions are identified that severely affect serum triglyceride levels in the study individuals. The method is designed for quantitative traits but can also be applied on qualitative traits. It is computationally feasible even for a large number of possible interactions and differs fundamentally from most previous approaches by entertaining nonlinear interactions and by directly addressing the multiple-testing problem.


Figures

F<sc>igure</sc> 1.—
Figure 1.—
ROC curves for the three methods in nonepistatic genetic scenarios Each genetic scenario represents 1000 simulations of 500 individuals with 20 SNPs. The prior for the MCMC method is chosen as formula image formula image σ ∼ U(0, ∞), formula image and formula image. In all scenarios unaffected individuals have a phenotype drawn from N(100, 100). (A) Affected individuals have at least one minor allele at a specific locus and have a phenotype drawn from N(102.5, 100). (B) Affected individuals have either one or two minor alleles at a specific locus and have a phenotype drawn from N(102.5, 100) or N(105, 100), respectively. (C) Affected individuals have at least one minor allele at one of two specific loci or at both loci and have a phenotype drawn from N(102.5, 100) or N(105, 100), respectively. (D) The same as in A but there is linkage between the loci.
F<sc>igure</sc> 2.—
Figure 2.—
ROC curves for the three methods in epistatic genetic scenarios Each genetic scenario represents 1000 simulations of 500 individuals with 20 SNPs. The prior for the MCMC method is chosen as formula image formula image σ ∼ U(0, ∞), formula image and formula image. In all scenarios unaffected individuals have a phenotype drawn from ∼N(100, 100). (A) In this simulation the affected, drawn from N(107.5, 100), are individuals carrying at least one risk allele at two specific loci. (B) In this simulation the affected, drawn from N(107.5, 100), are individuals carrying at least one risk allele at three specific loci. (C) Affected are individuals that have at least one minor allele at one of two specific combinations of two loci. There are two possible risk combinations and four risk loci. (D) The same as in A but there is linkage between the loci.
F<sc>igure</sc> 3.—
Figure 3.—
Results for a simulated scenario with 100 SNPs and 5000 unrelated individuals. Five 500,000-bp-long regions were simulated using the ms program. SNPs with a minor allele frequency of <0.05 and the SNPs in high LD (r2 > 0.95) were removed. Then 20 SNPs were randomly selected from each region and one SNP from each of the five regions with a minor allele frequency between 0.17 and 0.23 was chosen as a susceptibility SNP. Phenotypes were simulated so that the individuals with at least one minor allele at SNP8 and SNP34 had a phenotype drawn from N(103, 100) and individuals with at least one minor allele at SNP46, SNP77, and SNP82 had a phenotype drawn from N(104, 100). Individuals with minor alleles at all five susceptibility SNPs had a phenotype drawn from N(107, 100) and individuals without any of the two combinations had a phenotype drawn from N(100, 100). The prior for the MCMC method is chosen as formula image formula image σ ∼ U(0, ∞), formula image and formula image. The posterior distribution for the number of risk sets is shown at the top and the posterior probabilities for a SNP parameter being part of a risk set is shown at the bottom. Also, the P-values for the full single-locus linear model are shown as x's and the dashed and dotted lines denote P-values of 0.05 and 0.0005, respectively. The frequently sampled risk sets can be seen in Table 1.
F<sc>igure</sc> 4.—
Figure 4.—
Result for the MCMC analysis of SNPs and environmental factors affecting triglyceride. A total of 5300 individuals with three SNPs and three environmental factors were tested against fasting serum triglycerides. The triglyceride levels were logarithmically transformed before testing. formula image formula image σ ∼ U(0, ∞), nmG(0.5), and naG(0.5) but <5. The total run time was 5,000,000 with a thinning factor of 100. (A) The sampled likelihood score before removing a 50,000-iteration-long burn-in. (B) The posterior distribution of the number of risk sets. Only nonempty risk sets were counted. (C) The posterior for a parameter being part of a risk set. LIPC1 is the LIPC IVS1 + 49 C > T SNP, LIPC2 is the LIPC Ser215Asn SNP, and LIPC3 is the −514 T > C variant. GLU is the glucose tolerance status. (D and E) The values of the adjustment factors age and BMI. (F) The unadjusted mean for the individuals not placed in a risk set. The burn-in is shown as a dashed line.
F<sc>igure</sc> 5.—
Figure 5.—
Bar plots for some of the risk sets with high posterior probability. The mean serum triglyceride levels, with standard error bars, distributed on the genotypes are shown. The cohort is stratified according to the environmental factors for the risk sets in Table 2. Due to individuals belonging to two or more risk groups, the number of individuals in the bar plot might differ from the risk sets in Table 2. The numbers in the bars represent the number of individuals with this genotype.

References

    1. Baker, S. G., 2005. A simple loglinear model for haplotype effects in a case-control study involving two unphased genotypes. Stat. Appl. Genet. Mol. Biol. 4 14. - PubMed
    1. Bellman, R. E., 1961. Adaptive Control Processes. Princeton University Press, Princeton, NJ.
    1. Breiman, L., 2001. Random forest. Mach. Learn. 45 5–32.
    1. Breiman, L., J. H. Friedman, R. A. Olshen and C. J. Stone, 1984. Classification and Regression Trees, Ed. 1. Wadsworth, Belmont, CA.
    1. Brooks, S. P., and A. Gelman, 1998. General methods for monitoring convergence of iteractive simulations. J. Comp. Graph. Stat. 7 434–455.

Publication types