. 2007 May;13(5):570-8.
doi: 10.1038/nm1580. Epub 2007 Apr 15.

Osteopontin has a crucial role in allergic airway disease through regulation of dendritic cell subsets

Affiliations

Osteopontin has a crucial role in allergic airway disease through regulation of dendritic cell subsets

Georgina Xanthou et al. Nat Med. 2007 May.

Abstract

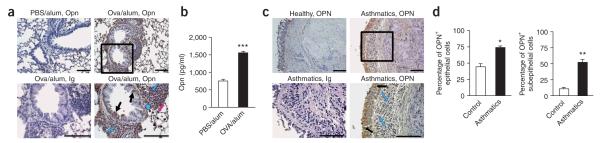
Osteopontin (Opn) is important for T helper type 1 (T(H)1) immunity and autoimmunity. However, the role of this cytokine in T(H)2-mediated allergic disease as well as its effects on primary versus secondary antigenic encounters remain unclear. Here we demonstrate that OPN is expressed in the lungs of asthmatic individuals and that Opn-s, the secreted form of Opn, exerts opposing effects on mouse T(H)2 effector responses and subsequent allergic airway disease: pro-inflammatory at primary systemic sensitization, and anti-inflammatory during secondary pulmonary antigenic challenge. These effects of Opn-s are mainly mediated by the regulation of T(H)2-suppressing plasmacytoid dendritic cells (DCs) during primary sensitization and T(H)2-promoting conventional DCs during secondary antigenic challenge. Therapeutic administration of recombinant Opn during pulmonary secondary antigenic challenge decreased established T(H)2 responses and protected mice from allergic disease. These effects on T(H)2 allergic responses suggest that Opn-s is an important therapeutic target and provide new insight into its role in immunity.


Figures

Figure 1
Figure 1
Expression of Opn in the lung in allergic airway disease. (a) Photomicrograph of lung sections from PBS/alum-sensitized BALB/c mice (alum controls) and OVA/alum-sensitized BALB/c mice stained with Opn-specific antibody. Immunized mice also received three challenges with aerosolized OVA. In OVA/alum mice, Opn was expressed by infiltrating leukocytes (blue arrows), including macrophages (blue arrowhead), by bronchial epithelial cells (black arrows) and by alveolar epithelial cells (pink arrow). Black rectangle corresponds to magnified version shown in bottom right panel. Ig control staining of a section from OVA/alum-sensitized mice is also shown. Specific staining is depicted in brown; nuclei are stained blue with hematoxylin. (b) Opn levels in lung homogenates of OVA/alum-sensitized mice and alum controls. Data are expressed as mean ± s.e.m. n = 6–8 mice per group in two independent experiments. ***P = 0.0025. (c) Photomicrograph of OPN expression in bronchial biopsies from healthy individuals and asthmatics, stained with OPN-specific antibody. OPN expression in the asthmatics was localized in bronchial epithelial cells (black arrows) and subepithelial infiltrating leukocytes (blue arrows). Ig control staining of a biopsy from an asthmatic is shown. (d) Percentages of OPN+ epithelial and subepithelial cells from lung biopsies of asthmatics and healthy individuals. Cell counts are expressed as mean ± s.e.m. For each biopsy, data were obtained using three high-power fields (×400). *P = 0.0033, **P = 0.0071 (unpaired Student’s t-test). Scale bars, 100 μm.
Figure 2
Figure 2
Opn-s blockade at priming reduces allergic disease. (a) Experimental protocol used to neutralize endogenous Opn-s during sensitization. BALB/c mice received two doses of anti-Opn or Ig control before each OVA/alum sensitization. (b) BAL differentials are expressed as mean ± s.e.m. n = 6–8 mice per group, three independent experiments. ***P = 0.0008, *P = 0.0209 (unpaired Student’s t-test). (c) AHR responses for enhanced pause (Penh) in mice treated with either anti-Opn or Ig. **P = 0.010 (two-way repeated-measures analysis of variance (ANOVA), and unpaired Student’s t-test). (d) Lung inflammation (top) and mucus secretion (bottom). *P = 0.0269, **P = 0.0156 (unpaired Student’s t-test). Scale bar, 100 μm. (e) Lung levels of IL-4 (**P = 0.0015), IL-13 (*P = 0.0255), IL-10 (**P = 0.007), IFN-γ (P = 0.068), IL-12 (**P = 0.0026) and CCL11 (*P = 0.0377). (f) Levels of IL-4 (***P < 0.0001), IL-13 (*P = 0.0121), IL-10 (***P = 0.0002) and IFN-γ (**P = 0.0014) in supernatants of OVA-stimulated DLNs. Serum levels of OVA-specific IgE (*P = 0.0328), IgG1 (**P = 0.0072) and IgG2a (*P = 0.0437). (g) BALB/c mice were sensitized as above and challenged with OVA on day 18. Anti-Opn or the Ig control were administered before each sensitization. Percentages of T1/ST2+ DLN cells gated on CD3+CD4+ T cells are shown, along with isotype control staining for the T1/ST2 marker. One representative experiment of three. n = 3–5 mice per group. Lung levels of CCL17 (P = 0.1749) and CCL22 (*P = 0.0115) are shown.
Figure 3
Figure 3
Opn-s blockade at challenge enhances allergic disease. (a) Experimental protocol used to neutralize endogenous Opn-s during challenge. BALB/c mice received three doses of anti-Opn or Ig control before challenge. (b) BAL differentials are expressed as mean ± s.e.m. n = 5–8 mice per group, five independent experiments. *P = 0.0410, **P = 0.0276 (unpaired Student’s t-test). (c) AHR responses for Penh were analyzed as in Figure 2c. *P = 0.027, **P = 0.010 (t-test and two-way ANOVA). (d) Lung inflammation and mucus secretion. **P = 0.0052, *P = 0.0355 (obtained as in Figure 2d). Scale bar, 100 μm. (e) Lung levels of IL-4 (**P = 0.0067), IL-13 (**P = 0.0022), IL-10 (*P = 0.0122), IFN-γ (*P = 0.0186), IL-12 (P = 0.4268) and CCL11 (*P = 0.0163). (f) Levels of IL-4 (P = 0.0838), IL-13 (*P = 0.0118), IL-10 (***P < 0.0001), IFN-γ (P = 0.0794) in supernatants of OVA-stimulated DLN cells. Serum levels of OVA-specific IgE (P = 0.7173), IgG1 (P = 0.1299) and IgG2a (P = 0.1012). (g) Percentages of T1/ST2+ cells gated on CD3+CD4+ T cells. Isotype control staining for the T1/ST2 marker is shown. One representative experiment of three. n = 3–5 mice per group. Top, lung levels of CCL17 (*P = 0.0396) and CCL22 (*P = 0.0126) for mice that received one OVA challenge (and antibody treatment). Bottom, lung levels of CCL17 (**P = 0.0053) and CCL22 (**P = 0.0036) for mice that received three OVA challenges (and antibody treatment).
Figure 4
Figure 4
Spp1−/− mice exhibit enhanced TH2 responses. (a) Spp1+/+ and Spp1−/− mice were immunized with OVA/alum i.p. on days 0 and 12, and challenged through the airways with aerosolized OVA from day 18 to day 23. Differential cell counts in BAL from Spp1+/+ and Spp1−/− mice. **P = 0.0073 for total cell number, *P = 0.0320 for eosinophils. Data are expressed as mean ± s.e.m. n = 4–6 mice per group, three independent experiments. (b) IL-4 (***P < 0.0001), IL-13 (***P < 0.0001), IL-10 (***P < 0.0001) and IFN-γ (*P = 0.0455) levels in supernatants from OVA-stimulated DLN cells. (c) Levels of serum OVA-specific IgE (*P = 0.0415), IgG1 (*P = 0.0378) and IgG2a (P = 0.5660) from Spp1+/+ and Spp1−/− mice. (d) BALB/c mice were immunized with OVA/alum i.p. on days 0 and 12, and challenged through the airways with aerosolized OVA from day 18 to day 20. Either anti-Opn or Ig control was administered during both the OVA sensitization and challenge phases. OVA-specific IgE levels in the sera (*P = 0.0236) are shown. Values are expressed as mean ± s.e.m. n = 4–6 mice per group, two independent experiments. All P-values were obtained by unpaired Student’s t-test.
Figure 5
Figure 5
Opn-s blockade affects TH2 responses through DC recruitment. (a) IL-4 (**P = 0.0024), IL-13 (**P = 0.0017) and IFN-γ (*P = 0.0365) from OVA-stimulated cocultures of DLN CD11c+ cells with DO11.10 TH cells. Data are expressed as mean ± s.e.m. n = 4–6 mice per group, three independent experiments. (b) Percentages of DLN 7AADCD11c+B220Gr-1 cDCs (left, bottom), 7AADCD11c+B220+Gr-1+ pDCs (left, top) and 7AADCD11c+PDCA-1+Gr-1+ pDCs (right). Numbers of cDCs and pDCs (*P = 0.0166), and Alexa Fluor–OVA+ cDCs and pDCs (*P = 0.0221). (c) IFN-α (*P = 0.0143) from CpG-stimulated CD11c+ cells. (d) Percentages of 7AADPDCA-1+ cells. (e) IL-4 (*P = 0.0461, **P = 0.0176), IL-13 (*P = 0.016, **P = 0.0014, ***P = 0.0003) and IFN-γ (*P = 0.0283, **P = 0.0365) from OVA-stimulated DLNs. [3H]thymidine incorporation (TdR) of OVA-stimulated DLNs (**P = 0.0013, ***P = 0.0004). n = 4 mice per group, three experiments. c.p.m., counts per min. (f) Numbers of cDCs (***P = 0.0001) and pDCs (*P = 0.0375), and Alexa Fluor–OVA+ cDCs (*P = 0.0202) and pDCs (*P = 0.0116). n = 5–7 mice per group, three independent experiments. (g) BAL eosinophils (*P = 0.0351) and AHR (anti-Opn, blue line; Ig + 120G8, dashed line; anti-Opn + 120G8, orange line). *P = 0.0132, **P = 0.0034. n = 5–8 mice per group, two experiments. Lung IL-4 (*P = 0.0349, **P = 0.0491), IL-13 (*P = 0.0299), IL-10 (**P = 0.0064, ***P = 0.0006) and IFN-γ. (h) Results from OVA-stimulated DLNs. IL-4 (***P = 0.0002, *P = 0.0074, **P = 0.0076), IL-13 (*P = 0.0142), **P = 0.0016, ***P < 0.0001, ****P < 0.0001), IL-10 (*P = 0.0112, **P = 0.0025, ***P < 0.0001, ****P < 0.0001) and IFN-γ. [3H]thymidine incorporation of OVA-stimulated DLNs (****P = 0.0108, *P = 0.0116, **P = 0.0016, ***P = 0.0001). Unpaired Student’s t-test for all statistical analyses.
Figure 6
Figure 6
rOpn is protective during pulmonary challenge. BALB/c mice were treated as described in Methods. (a) Mice received rOpn before OVA/alum sensitization. Levels of IL-4 (P = 0.2266), IL-13 (*P = 0.0113) and IFN-γ (**P = 0.0079) in supernatants of OVA-stimulated DLN cells. (b–g) BALB/c mice received rOpn before OVA aerosol challenges. In b, BAL differentials (*P = 0.0430, **P = 0.0099, ***P = 0.0067). In c, AHR responses for Penh, analyzed as in Figure 2c (*P = 0.032, **P = 0.0038, ***P = 0.0083, ****P = 0.0017). In d, lung inflammation (top) and mucus secretion (bottom). Histological scores for H&E (*P = 0.03) and PAS (***P = 0.0002). Scale bar, 100 μm. In e, lung levels of IL-4 (*P = 0.0378), IL-13 (*P = 0.0141), IL-10 (*P = 0.04), IFN-γ (*P = 0.037), IL-12 (*P = 0.0271), CCL11 (**P = 0.0022), CCL17 (**P = 0.005) and CCL22 (***P γ 0.0001). In f, results from supernatants of OVA-stimulated DLN cells. Levels of IL-4 (***P < 0.0001), IL-13 (***P = 0.0003), IL-10 (P = 0.1322) and IFN-γ (*P = 0.0229). In g, serum levels of OVA-specific-IgE (P = 0.0589), IgG1 (P = 0.0703) and IgG2a (**P = 0.0045). Data are expressed as mean ± s.e.m. n = 6–8 mice per group in three independent experiments. Unpaired Student’s t-test for all statistical analyses.

Comment in

Similar articles

Cited by

References

    1. Mosmann TR, Cherwinski H, Bond MW, Giedlin MA, Coffman RL. Two types of murine helper T cell clone. I. Definition according to profiles of lymphokine activities and secreted proteins. J. Immunol. 1986;136:2348–2357. - PubMed
    1. Lucey DR, Clerici M, Shearer GM. Type 1 and type 2 cytokine dysregulation in human infectious, neoplastic, and inflammatory diseases. Clin. Microbiol. Rev. 1996;9:532–562. - PMC - PubMed
    1. Liu AH. Early intervention for asthma prevention in children. Allergy Asthma Proc. 2002;23:289–293. - PubMed
    1. Weber GF, Cantor H. The immunology of Eta-1/osteopontin. Cytokine Growth Factor Rev. 1996;7:241–248. - PubMed
    1. Patarca R, et al. Structural and functional studies of the early T lymphocyte activation 1 (Eta-1) gene. Definition of a novel T cell-dependent response associated with genetic resistance to bacterial infection. J. Exp. Med. 1989;170:145–161. - PMC - PubMed

Publication types