. 2007 May;80(5):895-910.
doi: 10.1086/517616. Epub 2007 Apr 6.

Hypomorphic mutations in the gene encoding a key Fanconi anemia protein, FANCD2, sustain a significant group of FA-D2 patients with severe phenotype

Affiliations

Hypomorphic mutations in the gene encoding a key Fanconi anemia protein, FANCD2, sustain a significant group of FA-D2 patients with severe phenotype

Reinhard Kalb et al. Am J Hum Genet. 2007 May.

Erratum in

  • Am J Hum Genet. 2007 Jul;81(1):196

Abstract

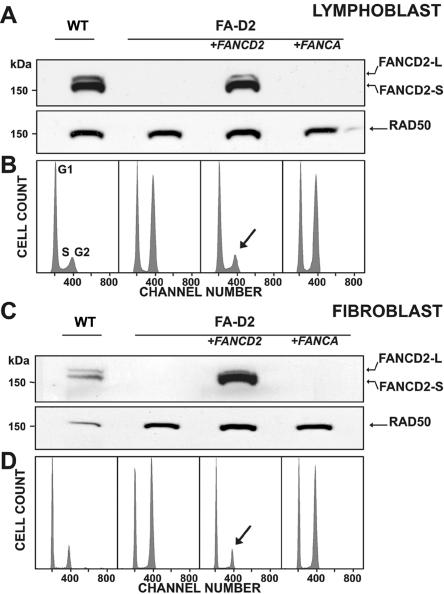
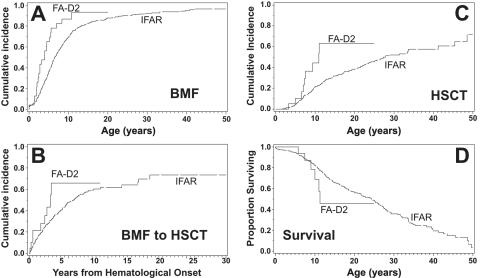
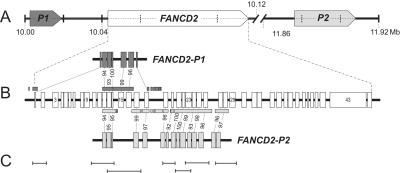
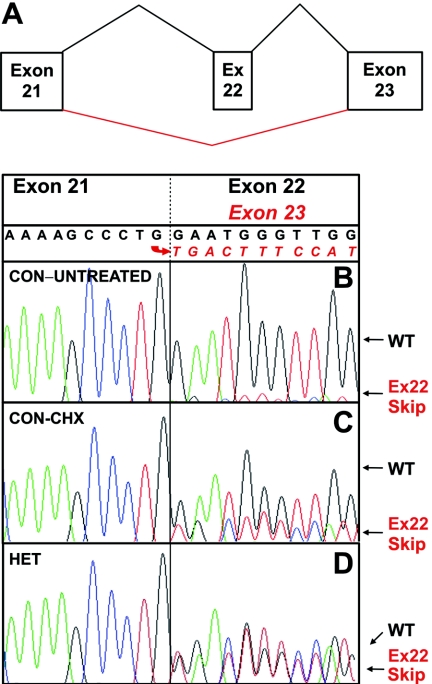
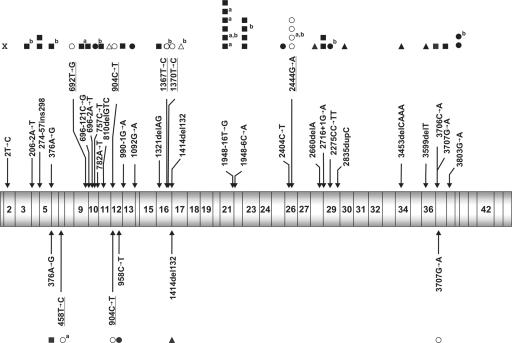
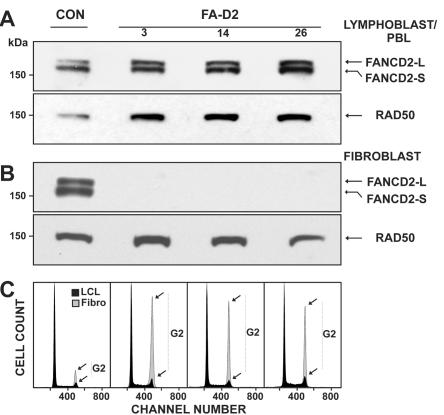
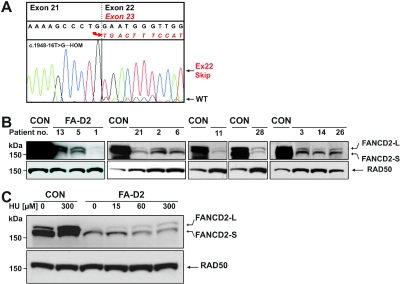
FANCD2 is an evolutionarily conserved Fanconi anemia (FA) gene that plays a key role in DNA double-strand-type damage responses. Using complementation assays and immunoblotting, a consortium of American and European groups assigned 29 patients with FA from 23 families and 4 additional unrelated patients to complementation group FA-D2. This amounts to 3%-6% of FA-affected patients registered in various data sets. Malformations are frequent in FA-D2 patients, and hematological manifestations appear earlier and progress more rapidly when compared with all other patients combined (FA-non-D2) in the International Fanconi Anemia Registry. FANCD2 is flanked by two pseudogenes. Mutation analysis revealed the expected total of 66 mutated alleles, 34 of which result in aberrant splicing patterns. Many mutations are recurrent and have ethnic associations and shared allelic haplotypes. There were no biallelic null mutations; residual FANCD2 protein of both isotypes was observed in all available patient cell lines. These analyses suggest that, unlike the knockout mouse model, total absence of FANCD2 does not exist in FA-D2 patients, because of constraints on viable combinations of FANCD2 mutations. Although hypomorphic mutations arie involved, clinically, these patients have a relatively severe form of FA.


Figures

Figure  1.
Figure 1.
Circular map of vector S11FD2IN. The retroviral-expression vector S11FD2IN contains a bicistronic construct of the full-length FANCD2 cDNA (“FANCD2”) and the neomycin resistance gene (NEO). Translation of the latter is ensured by an IRES. Also shown are the long terminal repeats (LTR), the restriction sites and their positions, and the bacterial resistance (AmpR). Used for cloning of FANCD2 into the target vector S11IN were the 5′ EcoRI and the 3′ SalI (insert) and BamHI (vector) sites; the latter two were destroyed by blunting.
Figure  2.
Figure 2.
Delineation of FA-D2. A, Assignment to group FA-D2 on the basis of the absence of either FANCD2 band on immunoblots after exposure of the patients’ cells to MMC, here shown for an LCL from patient 6 (lane 2). Transduction with FANCD2 cDNA with use of S11FD2IN restores both isoforms of FANCD2—S and L (lane 3)—similar to a nontransduced normal control (lane 1). Transduction with FANCA cDNA in the same vector fails to show such restoration (lane 4). B, Assignment to group FA-D2 on the basis of cell-cycle analysis. After exposure to MMC, the LCL of the same patient shows pronounced G2-phase arrest (56.6%) (lane 2; Hoechst 33342 staining). Transduction with FANCD2 cDNA by use of S11FD2IN reduces the G2 phase to normal (14.9%) (lane 3, arrow), similar to the nontransduced normal control (16.6%) (lane 1). Transduction with FANCA cDNA in the same vector fails to reverse the G2-phase arrest (53.1%) (lane 4). Panels C and D are analogous to panels A and B and show complementation with cultured fibroblasts from patient 10; staining in panel D was with 4',6-diamidino-2-phenylindole (DAPI). G2-phase proportions in panel D are 20.3% (lane 1, control), 61.3% (lane 2, nontransduced FA), 19.9% (lane 3, FANCD2-transduced FA), and 58.5% (lane 4, FANCA-transduced FA). RAD50 [MIM 604040] was used as the loading control in panels A and C. WT=wild type.
Figure  3.
Figure 3.
Clinical course of 23 fully informative, nonmosaic FA-D2 patients in this study. A, The cumulative incidence of BMF of the FA-D2 patients in the present study (FA-D2) precedes that of all patients with FA in the IFAR (P=.001). B, The period from BMF to HSCT, which was shorter in the patients of the present study than in those of the IFAR (trending, P<.08). C, Cumulative incidence of HSCT of the FA-D2 patients in our study, which likewise antedates that of all patients in the IFAR (P<.01). D, Kaplan-Meier curves of survival, which suggest higher death rates of the FA-D2 patients than of all patients in the IFAR aged >10 years.
Figure  4.
Figure 4.
Topography of FANCD2, its pseudogenes, and the superamplicons. A, The two pseudogenes—FANCD2-P1 and FANCD2-P2—located upstream and downstream, respectively, of the functional FANCD2 gene. All three have the same orientation. The scale denotes Mb on chromosome 3. B, FANCD2 exons and their pseudogene equivalents, connected by dashed lines, indicating percentages of nucleotide identity. Homology also extends into many introns nearby, as indicated by the boxes beyond and below the active gene. C, Graphic presentation of the positions and sizes of 7 superamplicons relative to the active gene shown in panel B. These amplicons represent FANCD2 exon-exon or exon-intron regions. Unique primer-binding sites ensure specific amplification.
Figure  5.
Figure 5.
Exon 22 splicing. A, Schematic depiction of the splicing patterns resulting from exon 22 retention or skipping. B, cDNA sequencing in an LCL from a normal control (CON), showing predominance of exon 22 sequence following that of exon 21 but also low levels of underlying sequence readable as exon 23. C, Treatment of the same LCL from a normal control with CHX for 4 h before cDNA synthesis, which increases the relative level of sequence with exon 22 skipping. D, cDNA sequencing in an LCL from a compound heterozygote (HET) for splice-acceptor mutation in intron 21, c.1948-16T→G (patient 9), which shows comparable levels of inclusion and exclusion of exon 22 sequence following that of exon 21. Ex=exon; WT=wild type.
Figure  6.
Figure 6.
Positions and identity of mutations detected in FANCD2. Mutations identified in the present study are shown above, mutations reported elsewhere, are indicated below the schematic display of FANCD2 cDNA. Blackened squares (▪) represent mutations resulting in aberrant splicing patterns, blackened circles (•) represent nonsense mutations, unblackened circles (○) represent missense mutations, blackened triangles (▴) represent frameshift deletions or duplications, and unblackened triangles (Δ) represent in-frame deletions or duplications. Missense mutations are depicted above or below the other mutations and are underlined. Superscript a at the right upper corner of a symbol denotes homozygous occurrence (2 alleles); superscript b denotes an affected sibling (relationship bias). Mutation 3707G→A was originally reported as a missense mutation, whereas we characterized it as a splicing mutation.
Figure  7.
Figure 7.
Reverse mosaicism. Blood-derived cells from FA-D2 patients with reverse mosaicism of the hematopoietic system (patients 3 and 26, LCLs; patient 14, stimulated PBL; panel A, lanes 2, 3, and 4) reveal both FANCD2 bands at levels similar to a random normal control (lane 1) after exposure to MMC. In contrast, neither FANCD2 band was present in fibroblasts from the same patients, but only in the control (B). RAD50 was used as loading control in panels A and B. The LCLs and PBL used in panel A fail to show G2-phase arrest on flow cytometric cell cycle distributions in response to MMC (panel C) (black histograms indicate DAPI stain; control (CON), 8.0% G2; patient 3, 8.8% G2; patient 14, 8.8% G2; patient 26, 10.4% G2), whereas the corresponding cultured FA-D2 fibroblasts retain high G2-phase accumulations, which is again in contrast to the non-FA control (superimposed gray histograms; CON, 22.6% G2; patient 3, 53.2% G2; patient 14, 56.0% G2; patient 26, 54.8% G2). PBLs in panel A were stimulated with anti-CD3, anti-CD28, and Il-2 and, in panel B, with PHA.
Figure  8.
Figure 8.
Residual FANCD2 protein. A, Exon 23 sequence following that of exon 21 (exon 22 exclusion, aberrant splicing), which prevails in cDNA from homozygotes for the splice-acceptor mutation in intron 21, c.1948-16T→G, but, at low level, underlying sequence is readable as exon 22 (exon inclusion). Depicted are results from patient 5. B, Blood-derived cells from nonmosaic FA-D2 patients (exemplified 13, 5, 1, 21, 2, 6, 11, and 28) show faint but conspicuous FANCD2 bands of both species in response to MMC exposure exclusively on overexposed immunoblots, as indicated by the very intense FANCD2 signals of the normal controls (CON) (patient 13, stimulated PBL; patients 5, 1, 21, 2, 6, 11, and 28, LCLs; loading control RAD50). The individual abundance of residual protein varies considerably at low levels. C, LCLs were subjected to the indicated concentrations of hydroxyurea (HU) for 16 h. On an overexposed blot, the FANCD2-L band of the residual protein in the LCL from patient 21 increases with the HU concentration in a dose-dependent response. Normal control LCLs are distinctive by their prominent FANCD2 signals.

References

Web Resources

    1. ClustalW, ftp://ftp-igbmc.u-strasbg.fr/pub/ClustalX (for the polypeptide sequences compared using the Windows interface ClustalX [v. 1.81, for the multiple sequence-alignment program])
    1. CpG Island Explorer, http://bioinfo.hku.hk/cpgieintro.html (for promoter analyses [v. 1.9, at the settings GC 60%, CpG O/E ratio 0.7, and minimum length 500 nt)
    1. Ensembl Genome Browser, http://www.ensembl.org/ (for FANCD2 genomic sequences [accession number ENSG00000144554] and Fancd2 sequence information for other species)
    1. ESEfinder, http://rulai.cshl.edu/tools/ESE/ (for analysis of regulatory splice sequences)
    1. ExPASy, http://www.expasy.org/sprot/ (for the Swiss-Prot Fancd2 protein sequences of different species, including Homo sapiens)

References

    1. Joenje H, Patel KJ (2001) The emerging genetic and molecular basis of Fanconi anaemia. Nat Rev Genet 2:446–45710.1038/35076590 - DOI - PubMed
    1. Levitus M, Rooimans MA, Steltenpool J, Cool NF, Oostra AB, Mathew CG, Hoatlin ME, Waisfisz Q, Arwert F, de Winter JP, et al (2004) Heterogeneity in Fanconi anemia: evidence for 2 new genetic subtypes. Blood 103:2498–250310.1182/blood-2003-08-2915 - DOI - PubMed
    1. Reid S, Schindler D, Hanenberg H, Barker K, Hanks S, Kalb R, Neveling K, Kelly P, Seal S, Freund M, et al (2007) Biallelic mutations in PALB2 cause Fanconi anemia subtype FA-N and predispose to childhood cancer. Nat Genet 39:162–16410.1038/ng1947 - DOI - PubMed
    1. Xia B, Dorsman JC, Ameziane N, de Vries Y, Rooimans MA, Sheng Q, Pals G, Errami A, Gluckman E, Llera J, et al (2007) Fanconi anemia is associated with a defect in the BRCA2 partner PALB2. Nat Genet 39:159–16110.1038/ng1942 - DOI - PubMed
    1. Levran O, Attwooll C, Henry RT, Milton KL, Neveling K, Rio P, Batish SD, Kalb R, Velleuer E, Barral S, et al (2005) The BRCA1-interacting helicase BRIP1 is deficient in Fanconi anemia. Nat Genet 37:931–93310.1038/ng1624 - DOI - PubMed

Publication types

MeSH terms

Substances

LinkOut - more resources