Case Reports
. 2007 May;80(5):938-47.
doi: 10.1086/513607. Epub 2007 Mar 20.

Recurrent 10q22-q23 deletions: a genomic disorder on 10q associated with cognitive and behavioral abnormalities

Affiliations
Case Reports

Recurrent 10q22-q23 deletions: a genomic disorder on 10q associated with cognitive and behavioral abnormalities

Jorune Balciuniene et al. Am J Hum Genet. 2007 May.

Abstract

Low-copy repeats (LCRs) are genomic features that affect chromosome stability and can produce disease-associated rearrangements. We describe members of three families with deletions in 10q22.3-q23.31, a region harboring a complex set of LCRs, and demonstrate that rearrangements in this region are associated with behavioral and neurodevelopmental abnormalities, including cognitive impairment, autism, hyperactivity, and possibly psychiatric disease. Fine mapping of the deletions in members of all three families by use of a custom 10q oligonucleotide array-based comparative genomic hybridization (NimbleGen) and polymerase chain reaction-based methods demonstrated a different deletion in each family. In one proband, the deletion breakpoints are associated with DNA fragments containing noncontiguous sequences of chromosome 10, whereas, in the other two families, the breakpoints are within paralogous LCRs, removing approximately 7.2 Mb and 32 genes. Our data provide evidence that the 10q22-q23 genomic region harbors one or more genes important for cognitive and behavioral development and that recurrent deletions affecting this interval define a novel genomic disorder.


Figures
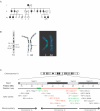
Figure  1.
Figure 1.
Pedigree of family UM10qDel-01 and mapping of the 10q deletion by G-banding and FISH. A, Pedigree structure. The arrow identifies the autistic proband. Blackened symbols indicate individuals with the deletion at 10q22.3-q23.31. The dotted line indicates a family member who has not been evaluated. Triangles indicate spontaneous miscarriage. III:3 died of presumed sudden infant death syndrome and was found to have a cardiac defect. B, G-banding and FISH. The left and middle panels show G-banded partial karyotype from one affected individual. The arrow points to the deleted band (10q23.31) (“n” denotes normal chromosome 10; “del” denotes the deletion-bearing chromosome). In the right panel is an example of FISH results from a BAC probe (RP11-926D9) mapping to the breakpoint region that shows a complex pattern of hybridization to the normal and deletion-bearing chromosomes. The normal chromosome 10 shows two closely spaced signals from 10q and an additional signal in a region near the centromere. In the deleted chromosome, the 10q signal is reduced to a single region, and the centromere-associated signal remains. C, Summary of FISH analysis. Chromosome 10 is represented, with a magnification of the region of interest surrounding 10q22.3-q23.31. In the bar representing the deletion map, LCR-containing regions are shown as green boxes, and the deleted sequences are in red. BACs (listed below the map) that did not hybridize to the affected chromosome are in red, BACs that gave the same signal from normal and deleted chromosomes are in black, and BACs from the breakpoint regions that gave multiple signals from normal chromosomes and altered signals from the affected chromosome 10 are in green. The mouse syntenic regions are also represented, with the arrows denoting the orientation of the mouse gene order. Note that breaks in the synteny correspond with the LCR positions.
Figure  2.
Figure 2.
Organization and intrachromosomal distribution of LCRs on 10q22.3-q23.31, along with a map of identified deletions. A, LCRs are grouped into four clusters (LCR1–LCR4). LCR3 and LCR4 flank the 10q22.3-q23.31 deletion in the UM10qDel-01 pedigree and in JHU10qDel-01. Blocks with the same color and/or pattern denote homologous sequences. The degree of sequence identity reflects evolutionary distance and ranges from 90.8% to 99.8%. Genomic position (in Mb) is shown on a scale below the LCRs. Exact chromosome position of depicted LCRs is available from the authors upon request. B, Map of deletions predicted by oligonucleotide array CGH. Three deletions are shown: that in JHU10qDel-01, that in JHU10qDel-02, and a consensus deletion for the two related individuals II:7 and III:6 (from family UM10qDel-01). The gray bar indicates intact DNA sequence. Hemizygous deletions are represented by red dashed lines. The gray dashed lines indicate genomic area that contains the telomeric breakpoints for JHU10qDel-01 and family UM10qDel-01. Genes residing in this genomic region are shown below the deletion map. Full names of the genes shown are given in table 1.
Figure  3.
Figure 3.
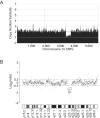
Whole-genome mapping of deletions in family UM10qDel-01 by use of 100K SNP array and 32K BAC array CGH analyses. A, 100K SNP array analysis. The panel represents SNP copy-number estimates for individual II:1 (fig. 1A). SNP copy number is derived from comparison of SNP intensities for the affected individual with those for unaffected controls by use of the chromosome copy-number tool (Affymetrix). B, 32K BAC array CGH analysis. Log2 intensity ratios for the same individual (II:1) show the correspondence of the copy-number measures obtained with this methodology. An idiogram of chromosome 10 is represented below the array data.
Figure  4.
Figure 4.
Deletions mapped by oligonucleotide array CGH in four patients: UM10qDel-01 family members III:6 and II:7, JHU10qDel-01 (J1), and JHU10qDel-02 (J2). Oligonucleotide probes (vertical colored bars) are arrayed in horizontal strips for each sample analyzed. In addition to the four patients, array data from three control subjects (C1–C3) are shown. Five different genomic areas (A–E) are arranged in accordance with their position on chromosome 10. LCRs, if present, are depicted as colored boxes below the corresponding probes. Size of the LCRs is proportional to the number of probes present and not to the actual genomic length. Log2 intensity ratios for each probe are represented in different colors and correspond to the degree of difference between experimental and reference signals. Green, blue, and aqua represent probes with negative log2 intensity ratios (copy loss), and tan, pink, and red represent probes with positive log2 intensity ratios (copy gain) in the test sample versus the reference. Red arrows indicate plausible breakpoints of predicted deletions, with genomic position noted above or below the arrows. Panel A shows the region containing the centromeric deletion breakpoint predicted in JHU10qDel-01 (J1), III:6, and II:7. Panel B shows a 96-kb hemizygous deletion predicted in JHU10qDel-02 (J2), which is centromeric to the cytogenetically identified deletion in this patient. Red block arrows indicate sequences that are associated with the end points of the telomeric deletion in JHU10qDel-02. Panel C shows the centromeric deletion breakpoint in JHU10qDel-02 (J2). Panel D contains the telomeric deletion breakpoints for JHU10qDel-01 (J1), III:6, and II:7. Panel E harbors the distal breakpoint for JHU10qDel-02 (J2).
Figure  5.
Figure 5.
Breakpoints and models for the rearrangement in JHU10qDel-02. A, Two deletions with an inversion and a small insertion. Diagrams of normal (top) and rearranged (bottom) chromosome 10 are represented. Breakpoint locations for the two identified deletions are indicated by arrows, with nucleotide positions (if known) shown above the arrows. The size of the deletions is indicated between the breakpoints. Beige boxes represent transcripts, brown boxes represent exons, and green boxes represent LCRs. A black dashed line symbolizes a deleted genomic region. This model suggests that sequence flanked by the two deletions is inverted, and fragment 3 (inverted relative to its original orientation) is inserted between the telomeric end of the large deletion and the inversion. Gray block arrows labeled with letters a, b, and c denote sequenced junctions. Sequences containing breakpoints are provided at the bottom of the figure; bold letters indicate junction sequence. B, Two deletions, with three noncontiguous fragments inserted between the end points of the larger one. Diagrams of normal (top) and rearranged (bottom) chromosome 10 are represented. Three fragments (blue block arrow labeled “1,” yellow block arrow labeled “2,” and purple triangle labeled “3”) are inserted between the end points of the large deletion. Size and chromosomal coordinates of the three fragments (1–3) are shown in the key box below. The question mark (?) indicates that the junction sequence is not defined. All other designations are the same as in panel A.

References

Web Resources

    1. CHORI BACPAC Resources, http://bacpac.chori.org/genomicRearrays.php
    1. Database of Genomic Variants, http://projects.tcag.ca/variation/
    1. HUGO Gene Nomenclature Committee, http://www.gene.ucl.ac.uk/nomenclature/index.html (for GHITM [accession number 17281])
    1. Human Genome Browser, http://genome.ucsc.edu/cgi-bin/hgGateway (for March 2006 assembly)
    1. Human Genome Segmental Duplication Database, http://projects.tcag.ca/humandup/

References

    1. Stankiewicz P, Lupski JR (2002) Genome architecture, rearrangements and genomic disorders. Trends Genet 18:74–8210.1016/S0168-9525(02)02592-1 - DOI - PubMed
    1. Bailey JA, Gu Z, Clark RA, Reinert K, Samonte RV, Schwartz S, Adams MD, Myers EW, Li PW, Eichler EE (2002) Recent segmental duplications in the human genome. Science 297:1003–100710.1126/science.1072047 - DOI - PubMed
    1. Cheung J, Estivill X, Khaja R, MacDonald JR, Lau K, Tsui LC, Scherer SW (2003) Genome-wide detection of segmental duplications and potential assembly errors in the human genome sequence. Genome Biol 4:R2510.1186/gb-2003-4-4-r25 - DOI - PMC - PubMed
    1. Zhang L, Lu HH, Chung WY, Yang J, Li WH (2005) Patterns of segmental duplication in the human genome. Mol Biol Evol 22:135–14110.1093/molbev/msh262 - DOI - PubMed
    1. Iafrate AJ, Feuk L, Rivera MN, Listewnik ML, Donahoe PK, Qi Y, Scherer SW, Lee C (2004) Detection of large-scale variation in the human genome. Nat Genet 36:949–95110.1038/ng1416 - DOI - PubMed

Publication types

MeSH terms