

Comparative Study
doi: 10.1085/jgp.200709745.
Epub 2007 Apr 16.
Partitioning of amino acid side chains into lipid bilayers: results from computer simulations and comparison to experiment
Affiliations
- PMID: 17438118
- PMCID: PMC2154372
- DOI: 10.1085/jgp.200709745
Item in Clipboard
Comparative Study
Partitioning of amino acid side chains into lipid bilayers: results from computer simulations and comparison to experiment
J Gen Physiol.
2007 May.
No abstract available
Figures
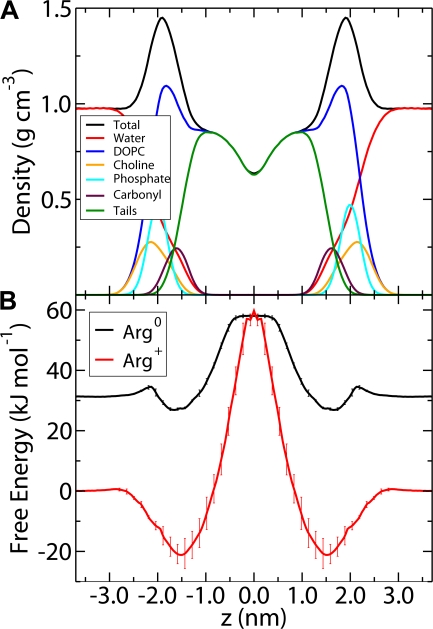
Partial density profiles and sample PMFs. (A) Partial density profiles of various lipid functional groups to serve as a reference for the location of different depths in the bilayer. (B) PMFs of the charged and neutral species of Arg. The neutral form has been shifted by the free energy to deprotonate an Arg in bulk water.
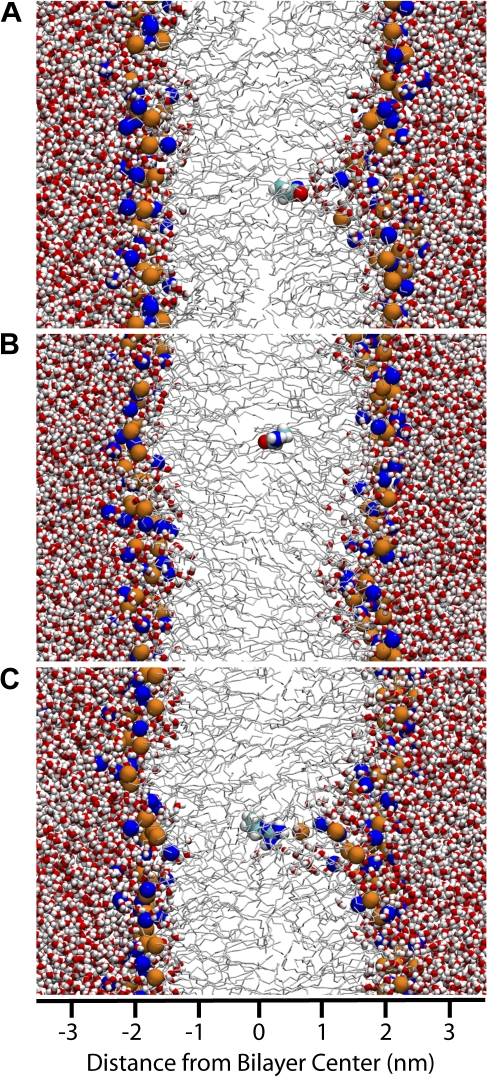
Selected snapshots of the simulated systems. Red and white sticks are water; DOPC phosphate groups are orange spheres; DOPC choline groups are blue spheres; the remainder of DOPC molecule is rendered as light gray lines. The space filling molecule in the center of the bilayer is the side chain of interest, colored as cyan (carbon), white (hydrogen), blue (nitrogen), and red (oxygen). (A) Snapshot of Gln at 0.4 nm from the center of the bilayer. The residue is stabilized by a large water defect. (B) Snapshot of Gln at 0.3 nm from the center of the bilayer. The water defect is no longer stable. (C) Snapshot of Arg at the center of the membrane. The water defect is stable over the length of the simulation (80 ns). Note that the water defect is partially lined by a lipid headgroup.
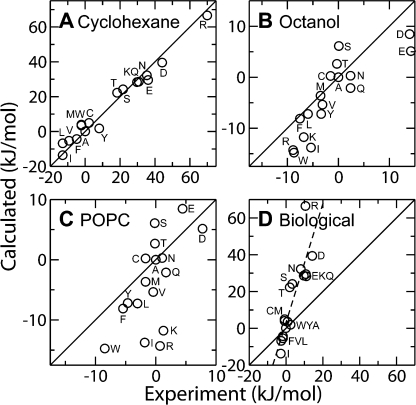
Comparison of calculated results (vertical axis) to experimental results (horizontal axis). Residues are indicated by a circle and labeled with the corresponding single letter amino acid code. Solid lines indicate perfect agreement between calculation and experiment. In all cases, the experimental and calculated results have been normalized to the free energy of Ala. (A) Comparison of the calculated free energy at the center of the membrane and the experimental water-cyclohexane transfer free energy (Radzicka and Wolfenden, 1988). (B) Correlation between the calculated free energy at the interface and the experimental octanol-water transfer free energy. Experimental values are taken from the ΔGWLXLL column of Table I in Wimley et al. (1996), normalized to the value of Ala. (C) Comparison of the calculated free energy at the interface and the experimental DOPC-water transfer free energy. Experimental data is taken from from the ΔGWLXLL column of Table I in Wimley and White (1996). (D) Comparison between the calculated free energy at the center of the membrane and biological free energy scale based on measurements using the Lep system (Hessa et al., 2005a). The dashed line is a linear regression to the data and has a slope of 3.4.
Comment in
-
Lonely arginine seeks friendly environment.J Gen Physiol. 2007 Aug;130(2):233-6. doi: 10.1085/jgp.200709819. Epub 2007 Jul 16. J Gen Physiol. 2007. PMID: 17635960 Free PMC article. No abstract available.
-
Concerning tryptophan and protein-bilayer interactions.J Gen Physiol. 2007 Aug;130(2):223-4. doi: 10.1085/jgp.200709829. Epub 2007 Jul 16. J Gen Physiol. 2007. PMID: 17635961 Free PMC article. No abstract available.
-
Bilayers as protein solvents: role of bilayer structure and elastic properties.J Gen Physiol. 2007 Aug;130(2):225-7. doi: 10.1085/jgp.200709841. Epub 2007 Jul 16. J Gen Physiol. 2007. PMID: 17635962 Free PMC article. No abstract available.
-
Using model membrane-inserted hydrophobic helices to study the equilibrium between transmembrane and nontransmembrane states.J Gen Physiol. 2007 Aug;130(2):229-32. doi: 10.1085/jgp.200709842. Epub 2007 Jul 16. J Gen Physiol. 2007. PMID: 17635963 Free PMC article. No abstract available.
-
Modeling charged protein side chains in lipid membranes.J Gen Physiol. 2007 Aug;130(2):237-40. doi: 10.1085/jgp.200709850. Epub 2007 Jul 16. J Gen Physiol. 2007. PMID: 17635964 Free PMC article. No abstract available.
