. 2007 Jun;27(12):4465-74.
doi: 10.1128/MCB.00104-07. Epub 2007 Apr 16.

Osteoblast autonomous Pi regulation via Pit1 plays a role in bone mineralization

Affiliations

Osteoblast autonomous Pi regulation via Pit1 plays a role in bone mineralization

Yuji Yoshiko et al. Mol Cell Biol. 2007 Jun.

Abstract

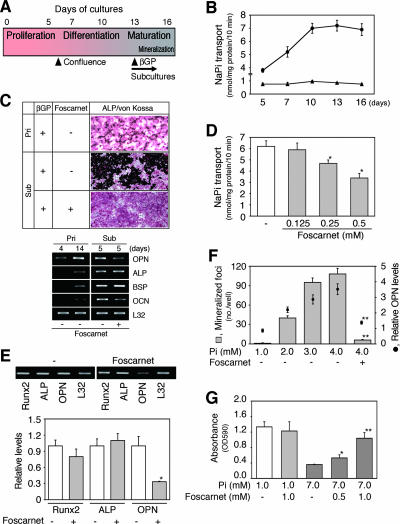
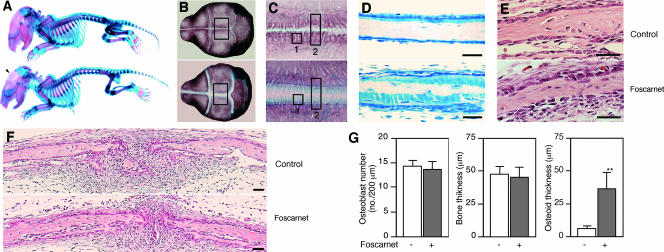
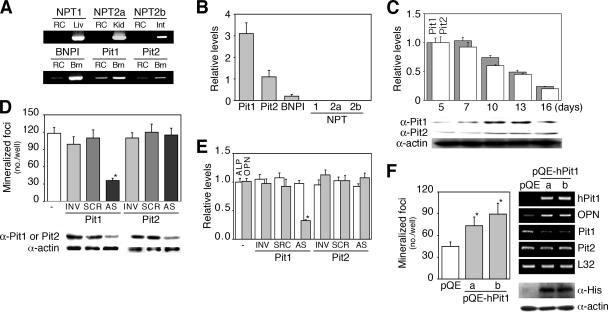
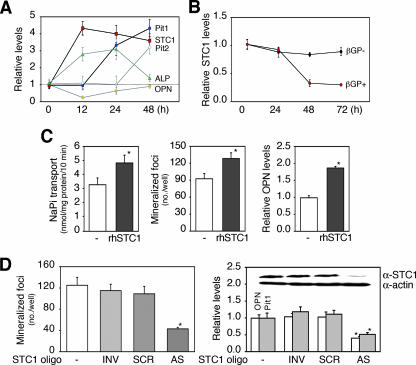
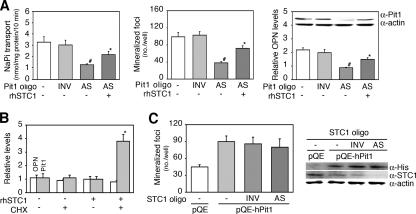
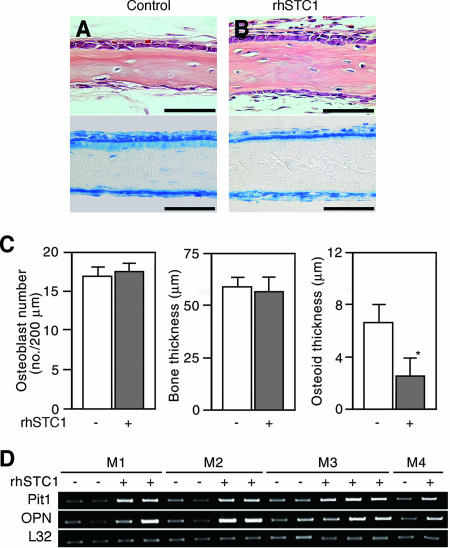
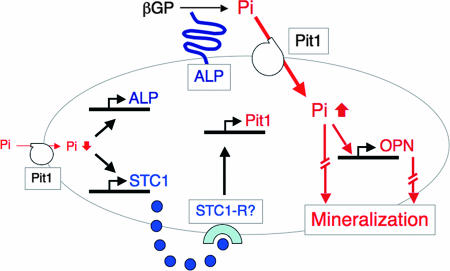
The complex pathogenesis of mineralization defects seen in inherited and/or acquired hypophosphatemic disorders suggests that local inorganic phosphate (P(i)) regulation by osteoblasts may be a rate-limiting step in physiological bone mineralization. To test whether an osteoblast autonomous phosphate regulatory system regulates mineralization, we manipulated well-established in vivo and in vitro models to study mineralization stages separately from cellular proliferation/differentiation stages of osteogenesis. Foscarnet, an inhibitor of NaP(i) transport, blocked mineralization of osteoid formation in osteoblast cultures and local mineralization after injection over the calvariae of newborn rats. Mineralization was also down- and upregulated, respectively, with under- and overexpression of the type III NaP(i) transporter Pit1 in osteoblast cultures. Among molecules expressed in osteoblasts and known to be related to P(i) handling, stanniocalcin 1 was identified as an early response gene after foscarnet treatment; it was also regulated by extracellular P(i), and itself increased Pit1 accumulation in both osteoblast cultures and in vivo. These results provide new insights into the functional role of osteoblast autonomous P(i) handling in normal bone mineralization and the abnormalities seen in skeletal tissue in hypophosphatemic disorders.


Figures

FIG. 1.
FIG. 1.
NaPi transport is closely correlated with mineralization in vitro. (A) Outline of proliferation-differentiation-maturation sequence in RC cell cultures. Cells actively proliferate, reach confluence (day 6), and subsequently differentiate and mature (day 13). When mature cells at days 13 to 14 were subcultured at a high cell density, mineralization was quickly initiated within 36 h in mature osteoblast cultures when βGP was added. (B) NaPi transport during osteoblast development in primary differentiating RC cell cultures. NaPi transport reached a maximum when cells fully differentiated and matured. Round and triangle symbols show Pi transport in the presence and absence, respectively, of sodium. (C) Typical ALP/von Kossa staining (upper panels) and osteoblast marker mRNA levels (lower panels) in primary (Pri) cultures (day 20) and osteoblast subcultures (Sub, day 6 after subculture of day 14 mature osteoblast primary cultures) in the presence of 10 mM βGP and with or without 0.5 mM foscarnet. Osteoblast subcultures uniformly stained with ALP (red) and manifested increased mineralized areas (black) in comparison to that of parallel primary cultures; foscarnet completely inhibited mineralization in osteoblast subcultures. (D) Foscarnet dose dependently inhibits NaPi transport in osteoblast subcultures. (E) Foscarnet decreases OPN mRNA but not Runx2 and ALP mRNA levels in osteoblast subcultures. Osteoblast subcultures (day 2) were treated with 0.5 mM foscarnet for 2 days in the presence of 5 mM βGP. Semiquantitative RT-PCR data are shown along with a representative agarose gel (upper panels). L32 was used as an internal control. *, P < 0.05, compared with vehicle (−). (F) The NaPi transporter is involved in mineralization. Pi loading to less than 4 mM increased not only mineralization but also OPN mRNA levels (semiquantitative RT-PCR as shown in panel E) in osteoblast subcultures, which was abrogated by treatment with 0.5 mM foscarnet. **, P < 0.01, compared with vehicle (−). (G) Overloading of Pi causes cell death via the NaPi transporter. The MTT assay reveals that foscarnet dose dependently blocked Pi-dependent cell death. Osteoblast subcultures were treated with Pi (7 mM) with or without foscarnet for 4 days. *, P < 0.05, and **, P < 0.01, compared with matched vehicle control (−).
FIG. 2.
FIG. 2.
Foscarnet injections over the sagittal suture of calvariae of newborn rats block mineralization of calvaria but not other skeletal elements. (A to F) Upper and lower panels show the vehicle (control)- and foscarnet-treated groups, respectively. (A to C). Whole-mount skeletons double stained with alcian blue (cartilage) and alizarin red (calcified bone) show that only the calvarium (arrowhead) is affected in rats treated with foscarnet over the calvaria. (A) Whole-body specimens show no systemic effects of locally injected foscarnet on any skeletal elements other than calvaria. (B) Higher magnification of the skulls shown in panel A. (C) Higher magnification of the enclosed areas in panel B. Markedly less mineralization is seen in foscarnet-treated calvariae; note the region stained with alcian blue but not with alizarin red. (D and E) Transverse sections of areas shown in boxes 1 and 2 in panel C. (D) Toluidine blue staining of plastic sections. A wider unmineralized seam (light blue staining) is seen in foscarnet-treated calvariae. (E and F) Hematoxylin and eosin staining of decalcified paraffin sections. No detectable histological differences other than the width of the osteoid seam, as shown in panel D, was seen between the two groups. Scale bars represent 50 μm. (G) Histomorphometric analyses of the osteoblast number (ectocranial surface), the width of the parietal bones, and the osteoid width in foscarnet- versus vehicle-treated bones. Measurements were made between 200 and 600 μm laterally from the sagittal suture. **, P < 0.01, compared with vehicle.
FIG. 3.
FIG. 3.
Pit1, the major type III NaPi transporter in osteoblasts, is essential for mineralization in vitro. (A) RT-PCR analysis of known NaPi transporters in RC cells. Pit1, Pit2, and BNPI, but neither NPT1, NPT2a, nor NPT2b, were detected. RC, RC cells (day 13 cultures). Liver (Liv), kidney (Kid), intestine (Int), and brain (Brn) tissues were used as positive controls. RT-PCR data are shown as a representative agarose gel. (B) Relative levels of NPT mRNAs in osteoblast subcultures. Real-time RT-PCR reveals that Pit1 mRNA is most abundantly expressed in osteoblasts, followed by that of Pit2; BNPI is only faintly detected. (C) Pit mRNA expression and protein accumulation during osteoblast development in primary RC cell cultures are shown. Real-time RT-PCR shows a decrease in Pit1 and Pit2 mRNA levels during osteoblast development. In contrast, a representative Western blot reveals a gradual increase in Pit1 and Pit2 proteins as osteoblasts mature (Fig. 1A). (D) AS knockdown of Pit1 but not Pit2 inhibits mineralization. Osteoblast subcultures were untreated or were treated with oligonucleotides (2 μM; AS, antisense; SCR, scrambled; INV, inverted) specific to Pit1 or Pit2 for 5 days. A representative Western blot shows specific effects of Pit1 and Pit2 AS oligonucleotides on their corresponding protein levels. *, P < 0.05, compared with vehicle (−). (E) AS knockdown of Pit1 decreases OPN but not ALP mRNA levels in osteoblast subcultures. Semiquantitative RT-PCR was performed with cultures parallel to those used for mineralization studies in panel D. (F) Cells overexpressing hPit1 express the phenotype opposite to those in the AS experiment. *, P < 0.05, compared with empty vector (pQE). hPit1 mRNAs in day 3 cultures and Pit1, Pit2, and OPN mRNA levels in day 5 cultures and His-tagged hPit1 in immunoblots at day 3 cultures are shown. Lanes a and b indicate osteoblasts transfected independently with two different pQE-hPit1 plasmids. Osteoblast subcultures were transfected with pQE plasmids at day 1 and further incubated for 5 days. Mineralization effects are shown with a representative agarose gel on the right (upper black lanes, RT-PCR) and Western blot (lower two lanes). L32 and actin were used as internal controls, shown in panels B, E, and F and in panels C, D, and F, respectively.
FIG. 4.
FIG. 4.
STC1 is coupled with Pi-mediated mineralization in vitro. (A) Sequential changes in expression levels of OPN, Pit1, STC1, and ALP mRNAs in cells treated with foscarnet. Osteoblast subcultures were treated with 0.5 mM foscarnet for 12 h and then screened for foscarnet-sensitive rapid response genes by semiquantitative RT-PCR. Among molecules screened (Table 2), only STC1 changed significantly (fourfold increase) by 12 h, and this was followed by an increase in Pit1 mRNA levels by 24 h. (B) STC1 mRNA levels were downregulated by βGP. Osteoblast subcultures were treated with 10 mM βGP at the times indicated and then subjected to real-time RT-PCR. STC1 mRNA levels decreased when mineralization was completed (∼48 h). (C) rhSTC1 increases NaPi transport, mineralization, and OPN mRNA expression in osteoblast subcultures. Cultures were grown under the same conditions as described for panel B; cultures were treated with 20 ng/ml rhSTC1 for 3 days under serum free-conditions for the NaPi transport assay and for 5 days under normal conditions for mineralization and OPN mRNA expression (semiquantitative RT-PCR). *, P < 0.05, compared with vehicle (−). (D) Cells with AS knockdown of STC1 expressed the opposite phenotypes to those treated with rhSTC1. Osteoblast subcultures were untreated or were treated with oligonucleotides (3 μM; AS, antisense; SCR, scrambled; INV, inverted) specific to STC1 for 5 days. *, P < 0.05, compared with vehicle (−). Semiquantitative RT-PCR reveals the downregulation of Pit1 as well as OPN mRNA. The inset in the right-hand graph shows Western blotting documenting the specific knockdown of STC1 by AS but not two control oligonucleotides. See above for semiquantitative RT-PCR and Western blotting. L32 and actin were used as internal controls in assays shown in panels A to C and D, respectively.
FIG. 5.
FIG. 5.
STC1 is functionally coupled to Pit1 for mineralization in vitro. (A) Coupling of Pit1 and STC1 is involved in mineralization. rhSTC1 partially rescued the decrease in NaPi transport, mineralization, and OPN mRNA expression elicited by AS knockdown of Pit1 (AS Pit1 oligo). Western blotting (inside the right-hand graph) and semiquantitative RT-PCR reveal that Pit1 protein and OPN mRNA levels were highly synchronized with NaPi transport activity and mineralization. Osteoblast subcultures were treated with or without 2 μM Pit1 oligonucleotides (Pit1 oligo, AS, or INV) in combination with or without 20 ng/ml rhSTC1 for 5 days. *, P < 0.05, and #, P < 0.05, compared with AS and vehicle (−), respectively. (B) Superinduction of Pit1 mRNA expression in response to rhSTC1 in the presence of cycloheximide (CHX). Osteoblast subcultures under serum-free conditions were treated with 20 ng/ml rhSTC1 in the presence or absence of 2 μg/ml CHX for 3 h and subjected to semiquantitative RT-PCR analysis. *, P < 0.01, compared with vehicle (−). (C) AS knockdown of STC1 had no detectable effect on the increased mineralization seen with hPit1-overexpressing cultures. Osteoblast subcultures were transfected with pQE-hPit1, followed by treatment with STC1 oligonucleotides (3 μM AS or INV) for 6 days. Western blotting shows that overexpression of hPit1 by pQE-hPit1 is not affected by AS knockdown of STC1. L32 and actin were used as internal controls for assays shown in panels B and A and C, respectively.
FIG. 6.
FIG. 6.
Bone mineralization progresses rapidly in response to injection of rhSTC1 over the sagittal suture of calvariae of newborn rats. (A and B) Transverse sections of the parietal bone treated with (B) or without (control) (A) rhSTC1 (5 μg/kg/day) for 5 days. Decalcified and paraffin-embedded sections stained with hematoxylin and eosin (upper panels) and plastic sections stained with toluidine blue (lower panels), respectively. Scale bars represent 50 μm. (C) A decrease in osteoid seams without any detectable change in either total bone thickness or osteoblast number in rhSTC1-treated calvariae (closed column). *, P < 0.05, compared with vehicle (−). (D) Pit1 and OPN mRNA levels are increased in RNA samples from individual calvaria of animals treated with rhSTC1 (+) compared to those of vehicle-treated animals (−). Mn indicates individual mothers and their pups; M1 to M3 each had four pups and M4 had two pups treated as indicated. Semiquantitative PCR was used to estimate changes in gene expression (see Materials and Methods); a representative agarose gel is shown. L32 was used as an internal control.
FIG. 7.
FIG. 7.
A schematic of the STC1-Pit1-Pi-sensing system in osteoblasts, deduced from this study. Among all elements that act to enhance bone mineralization, NaPi transport via Pit1 is a rate-limiting step in mineralization. Low levels of NaPi transport stimulate STC1 and ALP expression. STC1, as an autocrine/paracrine factor via a putative unknown receptor (perhaps STC1-R), induces Pit1 expression directly to increase NaPi transport. Increased intracellular Pi increases OPN expression and stimulates mineralization.

References

    1. ADHR Consortium. 2000. Autosomal dominant hypophosphataemic rickets is associated with mutations in FGF23. Nat. Genet. 26:345-348. - PubMed
    1. Aubin, J. E., J. B. Lain, and G. S. Stein. 2006. Bone formation: maturation and functional activities of osteoblast lineage cells, p. 20-29. In M. J. Favus (ed.), Primer on the metabolic bone diseases and disorders of mineral metabolism, 6th ed. American Society for Bone and Mineral Research, Washington, DC.
    1. Beck, G. R., Jr., and N. Knecht. 2003. Osteopontin regulation by inorganic phosphate is ERK1/2-, protein kinase C-, and proteasome-dependent. J. Biol. Chem. 278:41921-41929. - PubMed
    1. Beck, G. R., Jr. 2003. Inorganic phosphate as a signaling molecule in osteoblast differentiation. J. Cell. Biochem. 90:234-243. - PubMed
    1. Beck, G. R., Jr., B. Zerler, and E. Moran. 2000. Phosphate is a specific signal for induction of osteopontin gene expression. Proc. Natl. Acad. Sci. USA 97:8352-8357. - PMC - PubMed

Publication types

MeSH terms