. 2007 Jun;27(11):3911-9.
doi: 10.1128/MCB.01455-06. Epub 2007 Apr 16.

Microphthalmia transcription factor isoforms in mast cells and the heart

Affiliations

Microphthalmia transcription factor isoforms in mast cells and the heart

Sagi Tshori et al. Mol Cell Biol. 2007 Jun.

Abstract

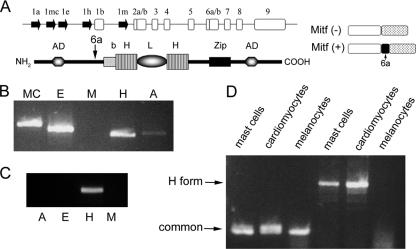
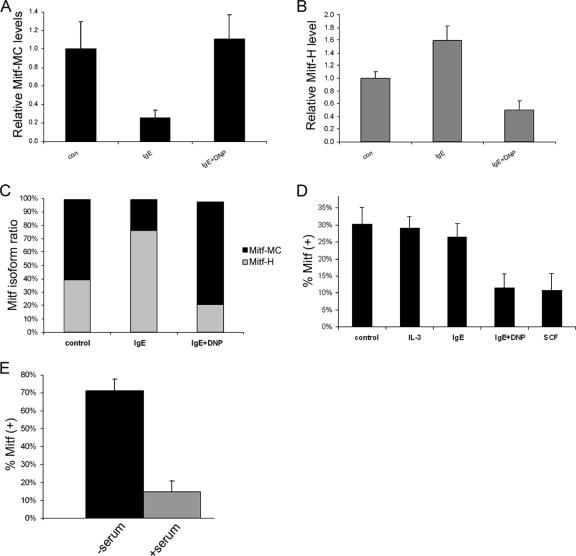
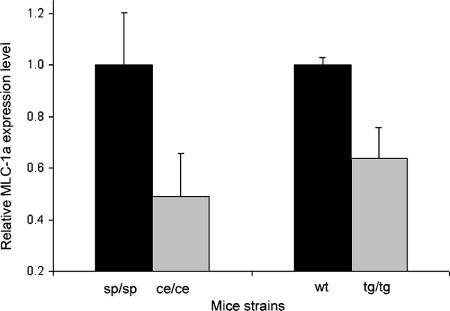
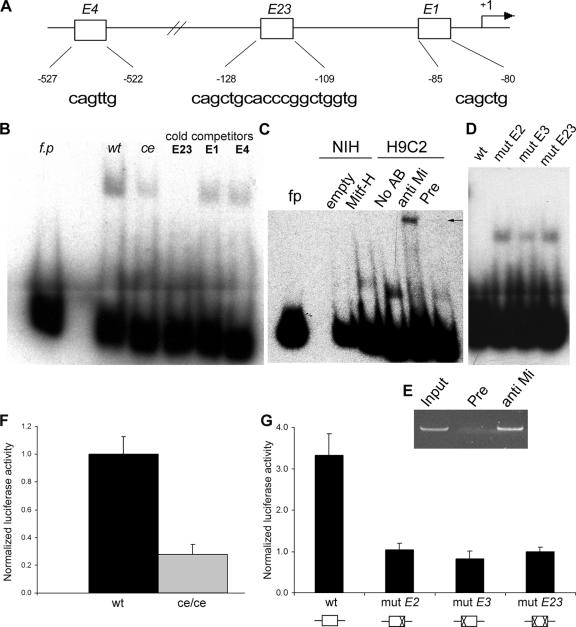
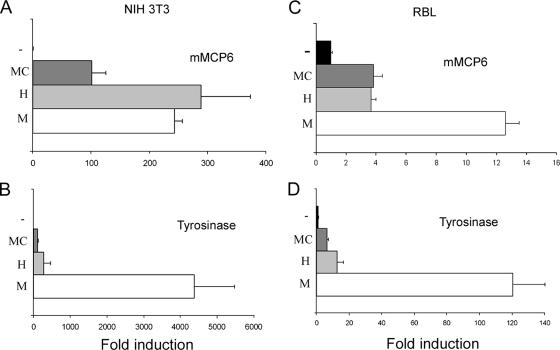
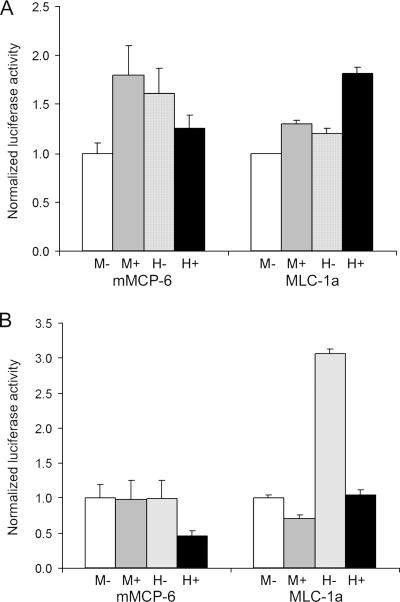
The microphthalmia transcription factor (Mitf) is critical for the survival and differentiation of a variety of cell types. While on the transcript level it has been noted that melanocytes and cardiomyocytes express specific Mitf isoforms, mast cells express several isoforms, mainly Mitf-H and Mitf-MC, whose function has not been thoroughly investigated. We found that in mast cells the expression of the specific Mitf isoforms is dependent on physiological stimuli that cause a major shifting of promoter usage and internal splicing. For example, activation of the c-kit signaling pathway almost totally abolished one of the main splice isoforms. Since cardiomyocytes express only the Mitf-H isoform, they were an ideal system to determine this isoform's physiological role. We identified that the expression of myosin light-chain 1a (MLC-1a) is regulated by Mitf-H. Interestingly, the transactivation of MLC-1a by Mitf-H in cardiomyocytes is decreased by overexpression of the splice form with exon 6a. In conclusion, we found that there is physiological switching of Mitf isoforms and that the promoter context and the cell context have a combined influence on gene expression programs.


Figures

FIG. 1.
FIG. 1.
Expression of various Mitf isoforms. (A) Genomic organization of the mi locus and the structure of Mitf protein. The genomic organization of the Mitf gene is depicted (top). Filled arrows represent alternative promoters. Empty boxes represent common exons. The structure of Mitf protein is depicted below: b, basic domain; HLH, helix-loop-helix; Zip, leucine zipper; AD, activation domain. The location of the alternatively spliced exon 6a is indicated by an arrow. The structures of Mitf-(−) and Mitf-(+) are also depicted (right). (B) Expression of Mitf isoforms in bone marrow-derived mast cells. Variable 5′ primers from exons 1mc, 1e, 1m, 1h, and 1a and from the common exon 2 were amplified by PCR. (C) Expression of Mitf isoforms in normal heart of mice. Variable 5′ primers from exons 1e, 1m, 1h, and 1a and from the common exon 2 were amplified by PCR. (D) Expression of Mitf and Mitf-H in mast cells, melanocytes, and primary cardiomyocytes. Mitf was amplifed by PCR using primers from the common exon 5 to exon 7 (common; lanes 1 to 3 from the left), and Mitf-H was amplified by PCR using different primers for exon 1h to exon 1b (H form; lanes 4 to 6).
FIG. 2.
FIG. 2.
Influence of physiological stimuli on Mitf isoform expression. (A and B) Real-time PCR analysis of Mitf-MC (A) and Mitf-H (B) expression in BMMC. Cells were activated with either IgE alone or IgE followed by DNP (IgE + DNP). con, control. Results represent mean ± standard error (n = 3). (C) Results of real-time PCR analysis of Mitf-H and Mitf-MC isoforms showing the relative amounts of the two isoforms expressed as a percentage of the total Mitf. (D) Analysis of the expression of exon 6a in BMMC. Cells were activated with either IL-3, IgE alone, IgE followed by DNP (IgE + DNP), or SCF. Exon 5 to exon 7 were amplified by PCR (25 cycles) and separated on 8% acrylamide gel, and the ratio between the positive and negative isoforms was determined by densitometry. Results are expressed as percentage of Mitf-(+) out of total Mitf. Results represent the mean ± standard error (n = 3). (E) Analysis of the expression of exon 6a in H9C2 cardiomyoctes. Cells were grown initially in Dulbecco's modified Eagle's medium (DMEM) supplemented with fetal calf serum (FCS). The medium was then replaced with either serum-free DMEM or fresh DMEM with FCS for 6 h. Results are expressed as percentage of Mitf-(+) out of total Mitf. Results represent the mean ± standard error (n = 5).
FIG. 3.
FIG. 3.
Real-time PCR analysis of MLC-1a expression levels in hearts of tg/tg and ce/ce mutant Mitf mice and their wild-type littermates. mRNA was extracted from hearts of wild-type (wt) and Mitf-mutated mice. mRNA quantitation was determined by SYBR green incorporation. Expression levels were normalized to that of the β-actin housekeeping gene. Results represent the mean ± standard error (n = 14 for tg/tg and n = 13 for ce/ce mice).
FIG. 4.
FIG. 4.
Mitf regulates MLC-1a expression through binding to E-box elements in MLC-1a promoter. (A) Four E boxes have been described in the proximal promoter region. E2 and E3 were included in one PCR fragment (E23). The sequence and the position of each of the four E boxes are depicted below. (B) EMSA results for MLC-1a promoter fragments are shown. E23 was used as a radiolabeled probe. fp, free probe; wt, wild-type Mitf; ce, ce/ce Mitf. E23, E1, and E4 were used as cold competitors with labeled E23. One representative experiment out of four is shown. (C) Binding of nuclear extracts of NIH 3T3 cells either overexpressing Mitf-H or transfected with an empty vector (empty). Supershifting of H9C2 nuclear extracts with either polyclonal anti-Mitf antibody directed against the common C terminus (anti Mi), preimmune serum (Pre), or without any sera (No AB) was performed. An arrow indicates the supershifted band. (D) E boxes E2 and E3 in the E23 element were point mutated to gTGtTG and gAGtTG, respectively, and were used for cold competition. Either wild-type E23 oligonucleotide (wt) or E23-mutated cold oligonucleotides (depicted as mut E2, mut E3, and mut E23), as indicated above each lane, competed with the normal E23 probe. (E) Chromatin immunoprecipitation assay in cardiomyocytes. Chromatin was immunoprecipitated with an anti-Mitf antibody directed against the C terminus of Mitf (anti Mi) or preimmune rabbit IgG (Pre) and then PCR amplified using primers for the MLC-1a promoter. (F) Transient transfection of NIH 3T3 cells with the MLC-1a promoter construct. Wild-type Mitf-H or ce/ce mutant plasmid constructs were cotransfected with the MLC-1a promoter reporter construct. The luciferase activity was normalized to that of total protein and divided by the value obtained for the wild type. The results shown represent the mean ± standard error (n = 4). (G) MLC-1a mutations in the E23 element. Either the wild-type MLC-1a promoter (wt) or MLC-1a E23 mutants (mut E2, mut E3, and mut E23) were cotransfected with Mitf expression vector. Luciferase activity was normalized as described above and divided by the value obtained for the E23 mutant promoter. A schematic representation of the different mutations is depicted below. The results shown represent the mean ± standard error (n = 3).
FIG. 5.
FIG. 5.
Transactivation of the mMCP-6 and tyrosinase promoters by different Mitf isoforms. (A and B) Mitf-M, Mitf-H, and Mitf-MC expression vectors or empty pcDNA vector (−) was cotransfected with reporters of mMCP-6 (A) and tyrosinase (B) into NIH 3T3 cells. Luciferase activity was normalized as described above and divided by the value obtained for the empty vector. The results shown represent the mean ± standard error (n = 4). (C and D) Expression vectors of Mitf-M, Mitf-H, and Mitf-MC or empty pcDNA vector (−) were cotransfected with reporters of mMCP-6 (C) and tyrosinase (D) into RBL cells. Luciferase activity was normalized as described above and divided by the value obtained for the empty vector. The results shown represent the mean ± standard error (n = 4).
FIG. 6.
FIG. 6.
Transactivation of mMCP-6 and MLC-1a promoters by different Mitf isoforms. Mitf-M-(−), Mitf-M-(+), Mitf-H-(−), and Mitf-H-(+) expression vectors were cotransfected with mMCP-6 and MLC-1a reporters into NIH 3T3 cells (A) and H9C2 cardiomyocytes (B). Luciferase activity was normalized to the result for Mitf-M-(−). The results shown represent the mean ± standard error (n = 4).
FIG. 7.
FIG. 7.
Sequence alignment of the putative glutamine-rich domain of Mitf. The sequences of the putative glutamine-rich domain from different species were aligned. Glutamine residues appear with gray boxes. Highly conserved residues are represented by asterisks.

References

    1. Bentley, N. J., T. Eisen, and C. R. Goding. 1994. Melanocyte-specific expression of the human tyrosinase promoter: activation by the microphthalmia gene product and role of the initiator. Mol. Cell. Biol. 14:7996-8006. - PMC - PubMed
    1. Bischoff, S. C., and G. Sellge. 2002. Mast cell hyperplasia: role of cytokines. Int. Arch. Allergy Immunol. 127:118-122. - PubMed
    1. Bismuth, K., D. Maric, and H. Arnheiter. 2005. MITF and cell proliferation: the role of alternative splice forms. Pigment Cell Res. 18:349-359. - PMC - PubMed
    1. Catala, F., R. Wanner, P. Barton, A. Cohen, W. Wright, and M. Buckingham. 1995. A skeletal muscle-specific enhancer regulated by factors binding to E and CArG boxes is present in the promoter of the mouse myosin light-chain 1A gene. Mol. Cell. Biol. 15:4585-4596. - PMC - PubMed
    1. Dennig, J., M. Beato, and G. Suske. 1996. An inhibitor domain in Sp3 regulates its glutamine-rich activation domains. EMBO J. 15:5659-5667. - PMC - PubMed

Publication types

MeSH terms

Substances

LinkOut - more resources