Comparative Study
. 2007 Apr 24;104(17):7187-92.
doi: 10.1073/pnas.0701777104. Epub 2007 Apr 16.

The same genomic region conditions clonal deletion and clonal deviation to the CD8alphaalpha and regulatory T cell lineages in NOD versus C57BL/6 mice

Affiliations
Comparative Study

The same genomic region conditions clonal deletion and clonal deviation to the CD8alphaalpha and regulatory T cell lineages in NOD versus C57BL/6 mice

Phillip D Holler et al. Proc Natl Acad Sci U S A. .

Abstract

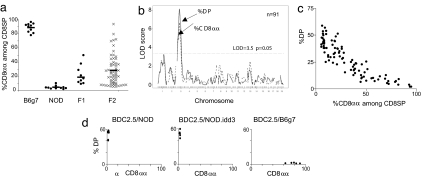
Clonal deviation is a mechanism by which immature thymocytes expressing a self-reactive T cell antigen receptor (TCR) are rescued from clonal deletion by adopting an alternative differentiation pathway resistant to apoptosis. Here, we confirm and generalize previous indications that genetic alleles in NOD mice condition ineffective clonal deviation toward the CD8alphaalpha lineage, a peculiar population of TCRalphabeta lymphocytes that electively colonizes the intraepithelial lymphocyte pool in the gut. Thymic selection of CD8alphaalpha cells was very age-dependent, occurring almost exclusively in the postnatal period. Fewer CD8alphaalpha cells were found in the thymus and intraepithelial lymphocytes of BDC2.5 TCR transgenic mice on the NOD than on the C57BL/6 (B6) background; this paucity extended to standard NOD mice, albeit to a lesser extent. CD8alphaalpha cells resided in the BDC2.5 pancreatic infiltrate, and they were more abundant on the B6 than the NOD background, correlating with aggressivity of the lesion. A (B6(g7) x NOD)F(2) intercross in agonist-challenged BDC2.5 fetal thymic organ cultures demonstrated the existence of a major quantitative trait locus on chromosome 3, coincident with an interval associated with resistance to clonal deletion. A replicate linkage confirmed these positions and showed that the same region also controls clonal deviation toward the CD4(+)FoxP3(+) regulatory T cell lineage. That clonal deviation toward the CD8alphaalpha and regulatory T cell pathways share genetic control further highlights the similarities between these two "rescue lineages," consistent with an immunoregulatory role for CD8alphaalpha cells.


Conflict of interest statement

The authors declare no conflict of interest.

Figures

Fig. 1.
Fig. 1.
CD8αα are T cells quantitatively induced by using agonist peptide in FTOC on the B6 but not the NOD background. (a) BDC2.5-Tg FTOCs on the NOD (Right) and B6g7 (Left) genetic backgrounds were incubated with 10 ng/ml mimotope peptide for 7 days and analyzed for expression of CD8α and CD8β (gated on BDC2.5+ thymocytes). (b) Absolute numbers of DP or CD8αα SP cells in these cultures are shown across a range of agonist peptide concentrations. (c) P14-Tg FTOCs on the NOD and B6g7 backgrounds were cultured with various concentrations of agonist peptide and analyzed as above (gated on Vα2+ thymocytes). Data are representative of three to five independent experiments.
Fig. 2.
Fig. 2.
BDC2.5+ CD8αα cells express transcripts typical of innate immune system cells. RNA was isolated from CD8αα and CD8αβ BDC2.5-Tg thymocytes purified from peptide-supplemented and peptide-negative FTOCs, respectively. Selected transcripts previously shown to be up-regulated in thymic CD8αα cells (3) were quantitated by using real-time PCR. Results are presented as the ratio of transcript levels (normalized to hypoxanthine phosphoribosyl transferase) in CD8αα versus CD8αβ thymocytes. The data shown represent one of two experiments.
Fig. 3.
Fig. 3.
CD8αα cells are preferentially selected on the B6 versus NOD backgrounds in vivo. (a) Thymocytes from BDC/Bg7 and BDC/NOD mice were isolated at 1 week (Left) and 5 weeks (Right) of age and analyzed by using cytometry (gated on BDC2.5+CD4CD8α+ thymocytes). Representative data of at least two thymi per group are shown. (b) Pancreatic lymph node cells from 7- to 9-week-old BDC/Bg7 and BDC/NOD mice. (Left) The plots are gated on live cells. (Right) The plots are further gated on BDC2.5+B220CD4CD8α+ cells. (c) IELs were isolated from 9- to 14-week-old BDC/Bg7 and BDC/NOD mice and analyzed by using flow cytometry (gated on BDC2.5+ cells). Representative data from two experiments are shown.
Fig. 4.
Fig. 4.
Fewer CD8αα cells on the NOD genetic background. (a and b) Lymphoid cells isolated from the pancreatic tissue from BDC2.5/Bg7 or BDC2.5/NOD mice at 3–4 weeks (a) and 8 weeks (b) of age. (a Left and b Left) The plots are gated on live cells. (a Right and b Right) The plots are further gated on BDC2.5+B220CD4CD8α+ cells (representative of two to four experiments). (c) Splenocytes from 7-week-old NOD and B6g7 mice (gated on TCRβ+CD4CD8α+ cells, representative of four individual mice/strains). (d) (Left) IELs from 8- to 10-week-old B6g7 and NOD mice (gated on TCRβ+ IELs). (Right) Compilation of the percentage of CD8αα IELs among TCRβ+ IELs in B6g7 (n = 7) versus NOD (n = 7) mice.
Fig. 5.
Fig. 5.
The same genetic regions condition clonal deletion and clonal deviation to CD8αα. (a) BDC2.5-Tg FTOCs on the B6g7, NOD, and F1 or F2 intercrosses were incubated with 10 ng/ml peptide for 7 days and analyzed by using flow cytometry. Means are indicated by a horizontal bar. (b) LOD plots for the F2 cohort with the percentage of DP and CD8αα cells out of the total number of CD8 SP cells as quantitative traits (n = 91). (c) Two-parameter scatter plot of the percentage of DP and CD8αα cells (of the total number of CD8 SP cells) for the F2 cohort. (d) Comparison of BDC2.5-Tg FTOCs on the NOD, NOD.Idd3R450, and B6g7 backgrounds (supplemented with 10 ng/ml mimotope peptide). The two-parameter scatter plots show the percentage of DP (indicating clonal deletion) and the percentage of CD8αα cells among CD8 SP cells (clonal deviation).
Fig. 6.
Fig. 6.
The same genetic regions condition clonal deviation to CD8αα and Treg cells. (a) BDC2.5-Tg F2 FTOCs (n = 56) were incubated with 10 ng/ml mimotope peptide for 7 days and analyzed by using flow cytometry for the percentage of CD8αα (of total CD8 SP cells), percentage of DP cells, and percentage of FoxP3+ cells (of total CD4 SP cells). (b) LOD plot for the whole-genome scan in this F2 cohort, with the percentage of CD8αα cells among CD8 SP cells, the percentage of DP cells, and the percentage of FoxP3+ among CD4 SP cells as quantitative traits. (c) Higher resolution view of the chromosome 3 region for the same scan as b.

References

    1. Guy-Grand D, Vassalli P. Curr Opin Immunol. 2002;14:255–259. - PubMed
    1. Cheroutre H. Immunol Rev. 2005;206:114–131. - PubMed
    1. Yamagata T, Mathis D, Benoist C. Nat Immunol. 2004;5:597–605. - PubMed
    1. Leishman AJ, Naidenko OV, Attinger A, Koning F, Lena CJ, Xiong Y, Chang HC, Reinherz E, Kronenberg M, Cheroutre H. Science. 2001;294:1936–1939. - PubMed
    1. Kern PS, Teng MK, Smolyar A, Liu JH, Liu J, Hussey RE, Spoerl R, Chang HC, Reinherz EL, Wang JH. Immunity. 1998;9:519–530. - PubMed

Publication types

LinkOut - more resources