. 2007;6(2):4.
doi: 10.1186/jbiol54.

Growth control of the eukaryote cell: a systems biology study in yeast

Affiliations

Growth control of the eukaryote cell: a systems biology study in yeast

Juan I Castrillo et al. J Biol. 2007.

Abstract

Background: Cell growth underlies many key cellular and developmental processes, yet a limited number of studies have been carried out on cell-growth regulation. Comprehensive studies at the transcriptional, proteomic and metabolic levels under defined controlled conditions are currently lacking.

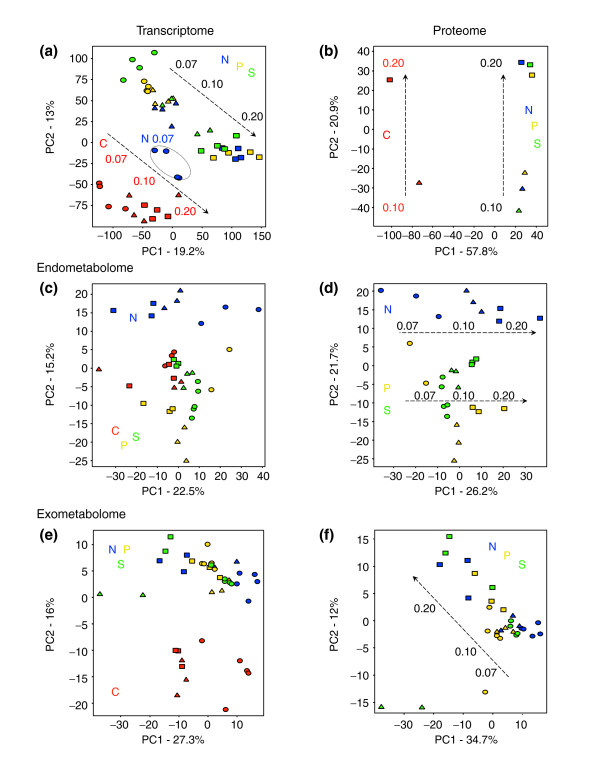
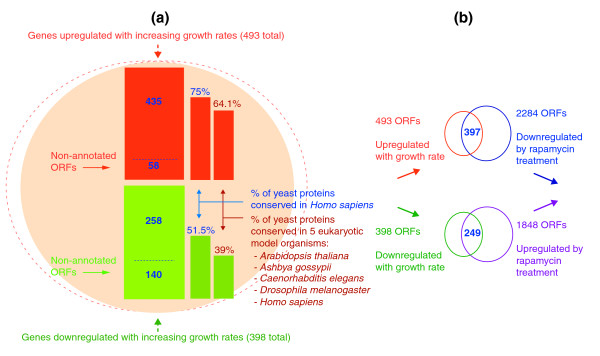
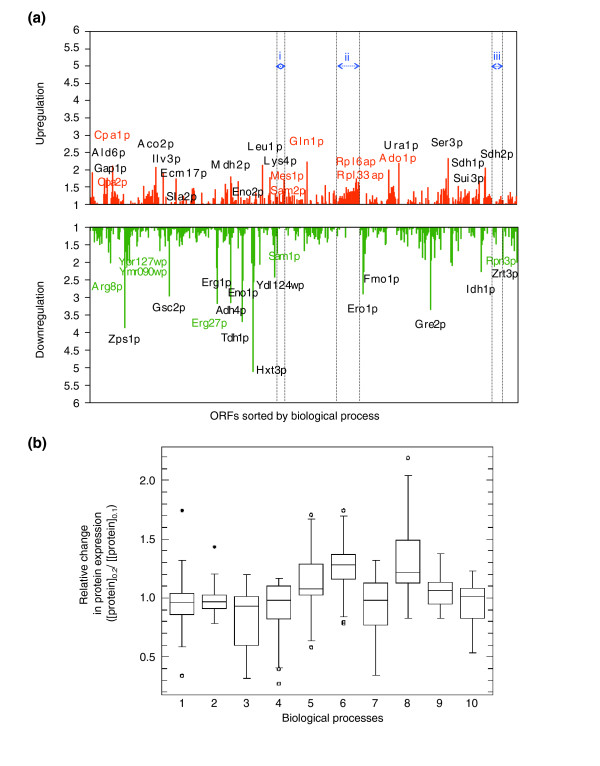
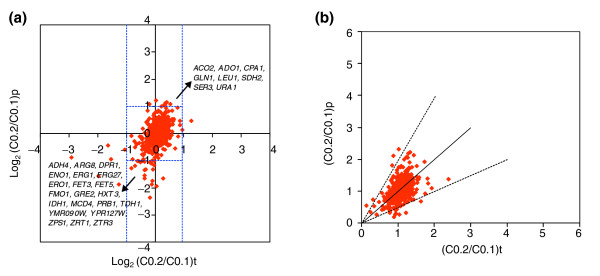
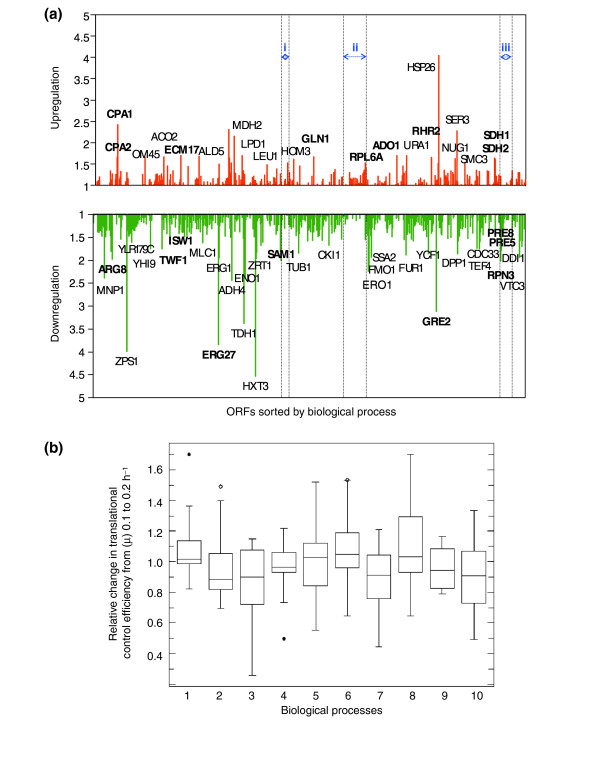
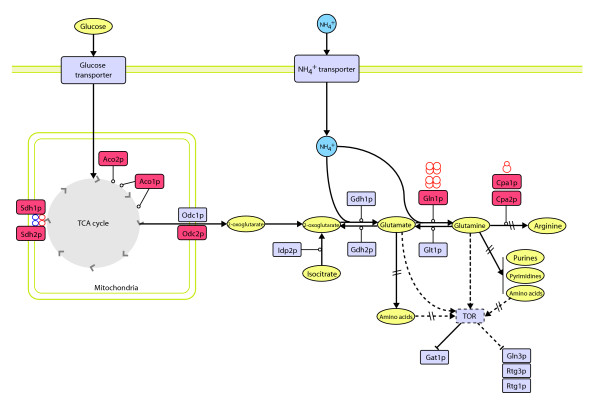
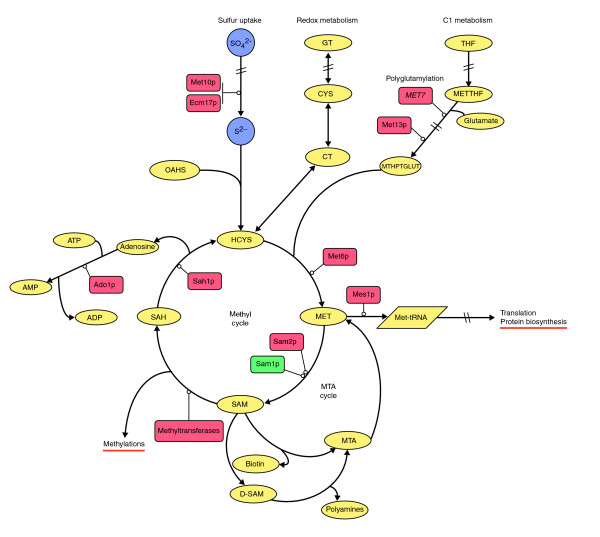
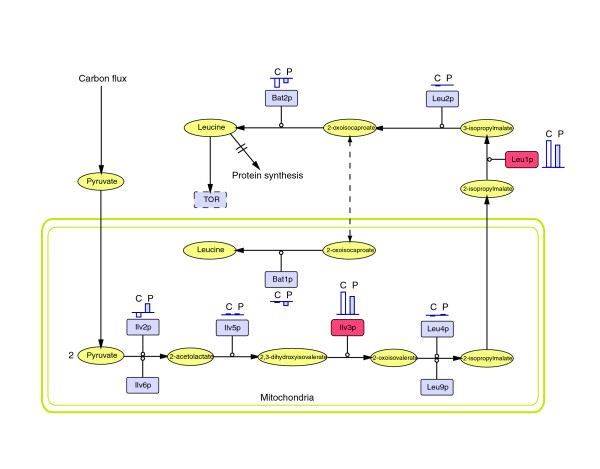
Results: Metabolic control analysis is being exploited in a systems biology study of the eukaryotic cell. Using chemostat culture, we have measured the impact of changes in flux (growth rate) on the transcriptome, proteome, endometabolome and exometabolome of the yeast Saccharomyces cerevisiae. Each functional genomic level shows clear growth-rate-associated trends and discriminates between carbon-sufficient and carbon-limited conditions. Genes consistently and significantly upregulated with increasing growth rate are frequently essential and encode evolutionarily conserved proteins of known function that participate in many protein-protein interactions. In contrast, more unknown, and fewer essential, genes are downregulated with increasing growth rate; their protein products rarely interact with one another. A large proportion of yeast genes under positive growth-rate control share orthologs with other eukaryotes, including humans. Significantly, transcription of genes encoding components of the TOR complex (a major controller of eukaryotic cell growth) is not subject to growth-rate regulation. Moreover, integrative studies reveal the extent and importance of post-transcriptional control, patterns of control of metabolic fluxes at the level of enzyme synthesis, and the relevance of specific enzymatic reactions in the control of metabolic fluxes during cell growth.

Conclusion: This work constitutes a first comprehensive systems biology study on growth-rate control in the eukaryotic cell. The results have direct implications for advanced studies on cell growth, in vivo regulation of metabolic fluxes for comprehensive metabolic engineering, and for the design of genome-scale systems biology models of the eukaryotic cell.


Figures

Figure 1
Figure 1
Principal components analyses (PCA) of steady-state chemostat cultures. The x and y axes represent the two main principal components (PC1, PC2), the groups responsible for the majority of the variance in each global dataset (see Materials and methods). PCA and growth-rate trends (dashed lines) at the (a) transcriptome (mRNA) level and (b) proteome level. (c,e) PCA and trends at the (c) endometabolome and (e) exometabolome level, respectively. (d,f) Same as (c) and (e) for carbon-sufficient chemostat series (N-, P- and S- limited series; see text for explanation). Each symbol represents a culture condition, colored as follows: red, carbon (C) limitation; blue, nitrogen (N) limitation; yellow, phosphate (P) limitation; green, sulfate (S) limitation. The symbol shape indicates the specific growth rate, μ, of the culture: ovals, μ = 0.07/h; triangles, μ = 0.1/h; rectangles, μ = 0.2/h. The circle round the blue ovals includes chemostat series exhibiting pseudohyphal growth (see text). As a test of reproducibility, for each nutrient-limiting condition, one of the three μ = 0.07/h exometabolome samples was analyzed in triplicate.
Figure 2
Figure 2
Cell-growth regulation of gene expression at the transcriptional level. (a) Groups of genes significantly upregulated (main red block) and downregulated (main green block) with growth rate irrespective of the nutrient-limiting condition, and their conservation in eukaryotes. The smaller blocks to the right represent the percentages of conserved orthologous proteins in Homo sapiens alone and in five model eukaryotic organisms [52]. The number of non-annotated open reading frames (ORFs) in up- and downregulated lists (that is, ORFs/genes of unknown function Affymetrix annotation 12 July 2006) is included. (b) Target-of-rapamycin (TOR) regulation at the transcriptional level. Genes upregulated and downregulated with growth rate are indicated by red and green circles, respectively. Groups of genes whose transcription is significantly downregulated by rapamycin treatment are indicated by the blue circle; those upregulated by the purple circle. Overlapping areas indicate groups of specific growth-related genes whose expression is significantly affected by rapamycin at the transcriptional level.
Figure 3
Figure 3
Gene-expression signatures at the protein level. (a) The graph shows the pattern of relative changes (fold change) in protein levels with a shift in growth rate (μ) from 0.1 to 0.2/h (doubling time, Td = 6.9 to 3.5 h) under conditions of carbon limitation (663 proteins in total). ORFs were sorted by biological process [42]. i, Methionine biosynthesis; ii, protein biosynthesis; iii, ubiquitin-dependent protein catabolism. Red, upregulated protein expression; green, downregulated. Selected groups of proteins whose levels are consistently upregulated or downregulated with growth independently of culture condition are labeled in the appropriate color. (b) Box-plot of relative changes in protein expression from growth rate 0.1 to 0.2/h of proteins of representative biological processes (>10 proteins identified per process). 1, Cell wall organization and biogenesis; 2, endoplasmic reticulum (ER) to Golgi transport; 3, ergosterol biosynthesis; 4, glycolysis; 5, methionine biosynthesis and methionine metabolism; 6, protein biosynthesis; 7, protein folding; 8, purine nucleotide, purine base and pyrimidine base biosynthesis; 9, regulation of transcription; 10, ubiquitin-dependent protein catabolism. Open and solid dots indicate presence of outliers that lie more than 3 or 1.5 times the interquartile range, respectively.
Figure 4
Figure 4
Integration of proteome and transcriptome studies. Proteome-transcriptome correlations are determined by the relative changes in protein levels versus relative changes in transcriptional levels from μ = 0.1 to 0.2/h under conditions of carbon limitation. (a) Log2 correlations with the most relevant outliers (cases in which changes in transcript levels do not result in comparable changes at the protein level) named. (b) Correlations between relative changes in natural values. The lines with y/x slope 0.5, 1 and 2 respectively allow to delimit groups of protein/transcript pairs that are correlated (y/x ratio >1) and anti-correlated (y/x ratio <1), and their limits (majority of them with y/x ratios within 0.5 and 2; [0.5 <y/x ratio < 2]).
Figure 5
Figure 5
Cell-growth regulation of gene expression at the translational level. Translational control. (a) Patterns of relative changes in translational control efficiencies from growth rate (μ) 0.1 to 0.2/h, under conditions of carbon-limitation. ORFs sorted by biological process [42]. i, Methionine biosynthesis; ii, protein biosynthesis; iii, ubiquitin-dependent protein catabolism. Selected groups of transcripts whose translational control efficiency is consistently up- or downregulated with growth independently of culture condition are marked in bold. Red, upregulation; green, downregulation. (b) Box-plot of relative changes in translational control efficiencies from growth rate (μ) 0.1 to 0.2/h of transcripts in representative biological processes (>10 proteins identified per process). 1, Cell wall organization and biogenesis; 2, ER to Golgi transport; 3, ergosterol biosynthesis; 4, glycolysis; 5, methionine biosynthesis and methionine metabolism; 6, protein biosynthesis; 7, protein folding; 8, purine nucleotide, purine base and pyrimidine base biosynthesis; 9, regulation of transcription; 10, ubiquitin-dependent protein catabolism. Open and solid dots indicate presence of outliers that lie more than 3 or 1.5 times the interquartile (IQR) range, respectively.
Figure 6
Figure 6
Integration of proteome and metabolic control to show regulation of carbon and nitrogen metabolic fluxes at the protein (enzyme) level. Shown here are the coupling of carbon and nitrogen fluxes at the level of glutamate dehydrogenase (Gdh1p, Gdh2p) and glutamine synthetase (Gln1p), the regulation of arginine biosynthesis at the carbamoyl phosphate synthetase (Cpa1p, Cpa2p) level and amino-acid biosynthesis, and amino-acid sensing by TOR. Selected proteins with levels consistently upregulated (red) with growth independently of culture conditions are shown. Enzymes responsible for the cytosolic 2-oxoglutarate pool: Aco1p and Aco2p, aconitase and putative aconitase isoenzyme; Odc1p and Odc2p, mitochondrial 2-oxoglutarate transporters; Idp2p, NADP-specific isocitrate dehydrogenase. Enzyme subunits coupling the oxidation of succinate to the transfer of electrons to ubiquinone: Sdh1p and Sdh2p, succinate dehydrogenase, flavoprotein, and iron-sulfur protein subunits, respectively. Metabolic diagram from [42, 91, 92] and drawn using Cell Designer [136] and Adobe Illustrator [137].
Figure 7
Figure 7
Integration of proteome and metabolic control to show regulation of sulfur and C1 (folate) metabolic fluxes at the protein (enzyme) level. Selected proteins with levels consistently upregulated (red) or downregulated (green) with growth independently of culture conditions are shown. Sulfur, C1 metabolism, methyl cycle, methionine and S-adenosylmethionine (SAM) fluxes towards methylation of proteins, rRNAs and tRNAs, and protein biosynthesis are shown here. Metabolic pathways and enzymes are from [42,82, 103-105] and the diagram is drawn with Cell Designer [136] and Adobe Illustrator [137]. Reverse methionine biosynthetic pathways [83] have been omitted for clarity. Metabolite abbreviations: THF, tetrahydrofolate; METTHF, 5,10-methylenetetrahydrofolate; MTHPTGLUT, 5-methyltetrahydropteroyltriglutamate (donor of the terminal methyl group in methionine biosynthesis); GT, glutathione; CYS, cysteine; CT, cystathionine; OAHS, O-acetylhomoserine; HCYS, homocysteine; MET, methionine; SAM, S-adenosylmethionine; SAH, S-adenosylhomocysteine; D-SAM, decarboxylated S-adenosylmethionine; MTA, methylthioadenosine. Metabolic steps (genes/enzymes): Met10p, sulfite reductase alpha subunit; Ecm17p, sulfite reductase beta subunit; MET7, folylpolyglutamate synthetase (Met7p not detected; the relevance of polyglutamylation in the C1 metabolism branch was demonstrated at the transcriptional level (see text)); Met13p, methylenetetrahydrofolate reductase isozyme; Met6p, methionine synthase; Mes1p, methionyl-tRNA synthetase; Sam1p, S-adenosylmethionine synthetase isozyme; Sam2p, S-adenosylmethionine synthetase isozyme. Sah1p, S-adenosyl-L-homocysteine hydrolase; Ado1p, adenosine kinase.
Figure 8
Figure 8
Multiple enzyme regulation in the metabolic control of the leucine biosynthetic pathway at the protein level. In vivo relative changes in enzyme levels from μ = 0.1 to 0.2/h, under carbon- (C) and phosphate- (P) limiting conditions are indicated by the lengths of the gray and white bars next to each enzyme. Their position under or above the baseline indicates downregulation or upregulation, respectively. Leucine biosynthesis diagram and nomenclature from [42]; diagram drawn with Cell Designer [136] and Adobe Illustrator [137]. Enzymes consistently upregulated under both conditions are marked in red. Metabolic steps (enzymes): Ilv2p, acetolactate synthase; Ilv6p, regulatory subunit of acetolactate synthase; Ilv5p, acetohydroxyacid reductoisomerase; Ilv3p, dihydroxyacid dehydratase; Leu4p, 2-isopropylmalate synthase (main isozyme); Leu9p, 2-isopropylmalate synthase (minor isozyme); Leu1p, isopropylmalate isomerase; Leu2p, 3-isopropylmalate dehydrogenase; Bat1p, mitochondrial branched-chain aminoacid aminotransferase; Bat2p, cytosolic branched-chain amino-acid aminotransferase.

Similar articles

Cited by

References

    1. Kacser H, Burns JA. The control of flux. Symp Soc Exp Biol. 1973;27:65–104. - PubMed
    1. Warner JR. The economics of ribosome biosynthesis in yeast. Trends Biochem Sci. 1999;24:437–440. - PubMed
    1. Fingar DC, Blenis J. Target of rapamycin (TOR): an integrator of nutrient and growth factor signals and coordinator of cell growth and cell cycle progression. Oncogene. 2004;23:3151–3171. - PubMed
    1. Hall MN, Raff M, Thomas G, Eds . Cell Growth: Control of Cell Size Monograph 42. New York: Cold Spring Harbor Laboratory Press; 2004.
    1. Jorgensen P, Tyers M, Warner JR. Forging the factory: ribosome synthesis and growth control in budding yeast. In: Hall MN, Raff M, Thomas G, editor. Cell Growth: Control of Cell Size Monograph 42. New York: Cold Spring Harbor Laboratory Press; 2004. pp. 329–370.

Publication types

MeSH terms