. 2007 Apr 15;67(8):3862-70.
doi: 10.1158/0008-5472.CAN-06-4282.

p53 and p21 determine the sensitivity of noscapine-induced apoptosis in colon cancer cells

Affiliations

p53 and p21 determine the sensitivity of noscapine-induced apoptosis in colon cancer cells

Ritu Aneja et al. Cancer Res. .

Abstract

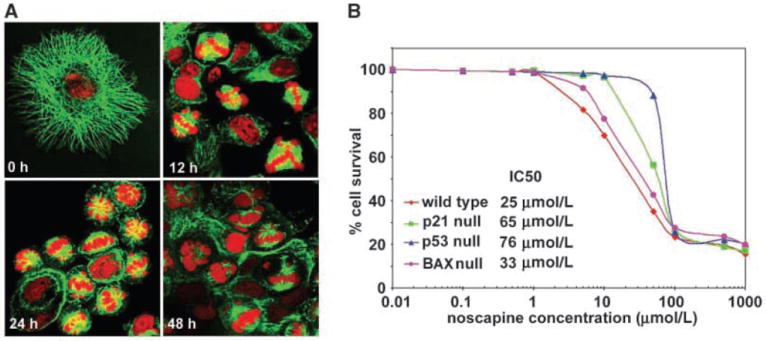
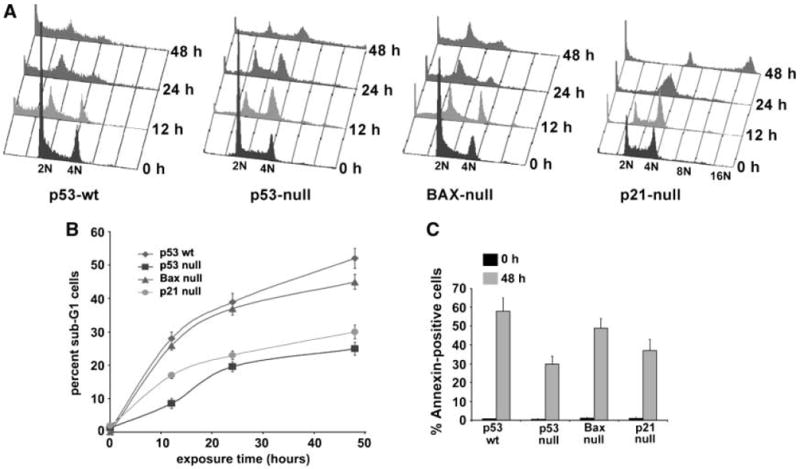
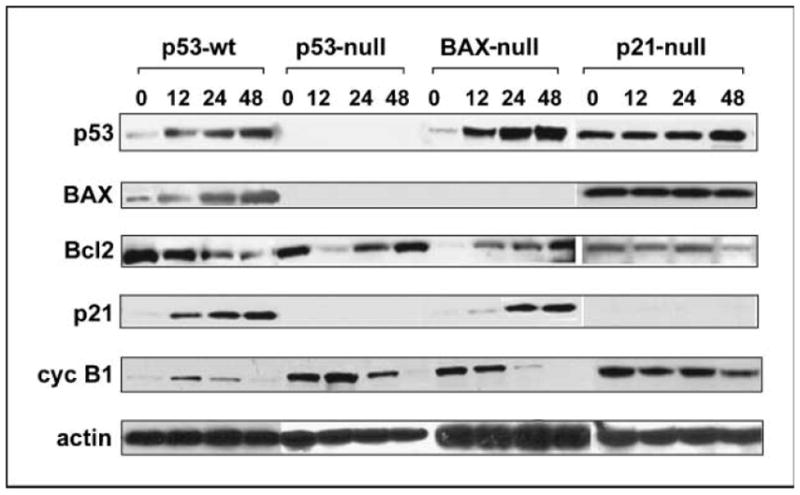
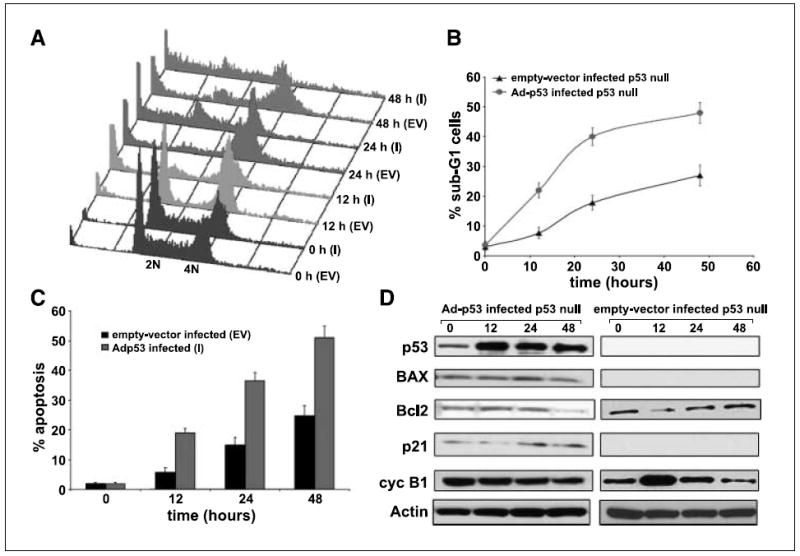
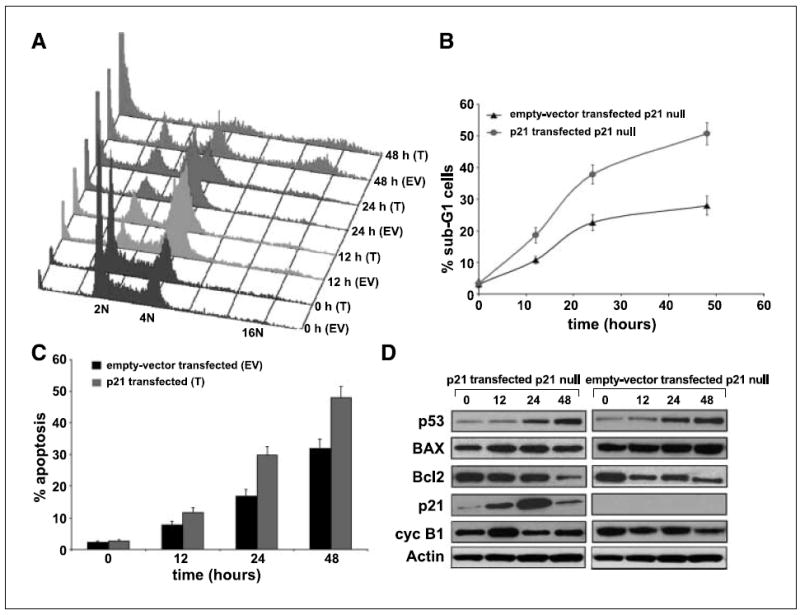
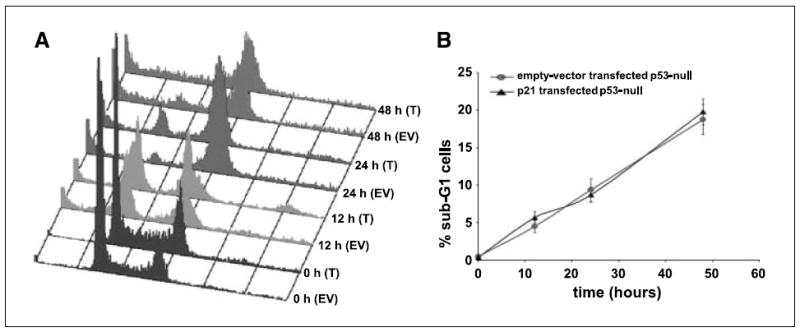
We have previously discovered the naturally occurring antitussive alkaloid noscapine as a tubulin-binding agent that attenuates microtubule dynamics and arrests mammalian cells at mitosis via activation of the c-Jun NH(2)-terminal kinase pathway. It is well established that the p53 protein plays a crucial role in the control of tumor cell response to chemotherapeutic agents and DNA-damaging agents; however, the relationship between p53-driven genes and drug sensitivity remains controversial. In this study, we compared chemosensitivity, cell cycle distribution, and apoptosis on noscapine treatment in four cell lines derived from the colorectal carcinoma HCT116 cells: p53(+/+) (p53-wt), p53(-/-) (p53-null), p21(-/-) (p21-null), and BAX(-/-) (BAX-null). Using these isogenic variants, we investigated the roles of p53, BAX, and p21 in the cellular response to treatment with noscapine. Our results show that noscapine treatment increases the expression of p53 over time in cells with wild-type p53 status. This increase in p53 is associated with an increased apoptotic BAX/Bcl-2 ratio consistent with increased sensitivity of these cells to apoptotic stimuli. Conversely, loss of p53 and p21 alleles had a counter effect on both BAX and Bcl-2 expression and the p53-null and p21-null cells were significantly resistant to the antiproliferative and apoptotic effects of noscapine. All but the p53-null cells displayed p53 protein accumulation in a time-dependent manner on noscapine treatment. Interestingly, despite increased levels of p53, p21-null cells were resistant to apoptosis, suggesting a proapoptotic role of p21 and implying that p53 is a necessary but not sufficient condition for noscapine-mediated apoptosis.


Figures

Figure 1
Figure 1
A, noscapine treatment of HCT116 colon cancer cells perturbed the spindle architecture and nuclear morphology. Confocal micrographs of HCT116 (p53 wt) cells treated with 25 μmol/L noscapine for 0, 12, 24, and 48 h. Intact normal radial arrays of microtubules and typical characteristic cellular morphologies of HCT116 cells are apparent at time 0 of treatment. As the time of noscapine treatment increases from 12 to 24 to 48 h, derangement of microtubule arrays (green) is evident. Mitotic figures begin to appear at 12 h and are abundant at 24 h. Forty-eight hours of treatment grossly perturbs the nuclear morphology as seen by the formation of large multilobed nuclei and the appearance of small spheroids of DNA (red) fragments, indicative of apoptosis. B, noscapine inhibits proliferation of HCT116 colon cancer cells. The percentage of cell proliferation at the indicated drug concentrations, compared with untreated cells, was measured by the standard sulforhodamine B assay. The four cell lines (p53-wt, p53-null, p21-null, and BAX-null) were grown in 96-well formats and treated with gradient concentrations of noscapine for 48 h. Plot of percent cell survival versus noscapine concentrations used for the determination of IC50 values. Points, average of three independent experiments.
Figure 2
Figure 2
Noscapine alters the cell cycle profile of HCT116 colon cancer cells. A, effect of 25 μmol/L noscapine over time on the cell cycle profile of HCT116 cells (p53-wt, p53-null, p21-null, and BAX-null) shown in a three-dimensional disposition. Cells were harvested for analysis at the noted hours, fixed and stained with propidium iodide, and analyzed by flow cytometry [fluorescence-activated cell sorting (FACS)] using the Cell Quest Software. X-axis, intensity of propidium iodide fluorescence, which is indicative of the total DNA content of cells in different phases of the cell cycle. Y-axis, number of cells detected for a given DNA content. Z-axis, time points (i.e., 0, 12, 24, and 48 h). Cells residing in the G0-G1 phase of the cell cycle are designated with 2N and cells in the G2 phase or in mitosis are designated with 4N. Less than 2N DNA is indicative of hypodiploid or sub-G1 population, a diagnostic of apoptosis. As the arrested mitotic cells plummet from a peak at ~12 h in p53-wt cells, the number of apoptotic cells increases in concordance. The p53-wt cells show maximum sensitivity to noscapine treatment whereas the p53-null cells are significantly resistant to the apoptotic effects of noscapine. The BAX-null cells showed an appreciable sub-G1 population. The p21-null cells also escape the effect of the drug and do not succumb to apoptosis. Interestingly, they traverse continually through the cell cycle and result in an accumulation of a polyploid population. Representative results of three experiments done in triplicate. B, quantitative graphical representation of percentage of sub-G1 population that is reflective of dying apoptotic cells. Points, average of three independent experiments; bars, SD (P < 0.05). C, noscapine induces apoptosis as revealed by the externalization of phosphatidylserine measured by the Annexin V staining assay. A graphical representation of the extent of apoptosis by quantitating the Annexin-positive cells on 48-h noscapine treatment of the various isogenic variants of the HCT116 cells. Columns, average of three independent experiments; bars, SD (P < 0.05).
Figure 3
Figure 3
Immunoblot analysis of untreated and noscapine-treated HCT116 cells. All the four cell types were grown in the presence of 25 μmol/L noscapine for 0, 12, 24, and 48 h. After the indicated times, cells were lysed and total protein was extracted, separated by SDS-PAGE, electrotransferred onto polyvinylidene difluoride membrane, and subjected to immunoblotting with the indicated primary antibodies followed by incubation with horseradish peroxidase–conjugated secondary antibodies. β-Actin was used as a loading control.
Figure 4
Figure 4
Reintroduction of the p53 wt gene in p53-null cells causes a complete restoration of the apoptotic response. p53-null cells were infected with an adenovirus (Ad) encoding the wild-type p53 gene and were subjected to noscapine exposure for 0, 12, 24, and 48 h. An empty vector control was used in the experiments to null the background effects of the adenovirus vector. A, three-dimensional FACS profile of Adp53-infected (I) and empty vector–infected (EV) cells for 0, 12, 24, and 48 h. B, quantitation of the percent sub-G1 population for Adp53-infected and empty vector–infected p53-null cells. C, graphical representation of the extent of apoptosis in Adp53-infected cells and empty vector–infected controls as evaluated by Annexin V staining followed by FACS analysis. Columns, average of three independent experiments; bars, SD (P < 0.05). D, immunoblot analysis of cell lysates from Adp53-infected and empty vector–infected p53-null cells.
Figure 5
Figure 5
Up-regulation of p53 is a necessary but not sufficient condition for noscapine-mediated apoptosis. The p21 gene is a crucial player mediating the apoptotic effects downstream of the p53 gene. Reintroduction of p21 in p21-null cells significantly increased the sub-G1 population and the extent of apoptosis as revealed by cell cycle experiments and Annexin V staining. A, cell cycle profiles of p21-transfected p21-null cells (T) along with their empty vector–transfected controls. B, graphical representation of the quantitation of the sub-G1 population. C, graphical depiction of the percent Annexin-positive cells for p21-transfected cells and empty vector–transfected controls on noscapine treatment for 0, 12, 24, and 48 h. Columns, average of three independent experiments; bars, SD (P < 0.05). D, immunoblot analysis of cell lysates from p21-transfected p21-null cells and empty vector–transfected controls.
Figure 6
Figure 6
A, cell cycle profiles on noscapine treatment over time of p21-transfected p53-null cells along with the empty vector–transfected controls. B, quantitation of the percent sub-G1 population for the p21-transfected and empty vector–transfected p53-null cells. Introduction of p21 in p53-null cells is not sufficient to restore apoptosis as seen by the absence of an increased sub-G1 population on p21 transfection.

References

    1. Joshi HC. Microtubule dynamics in living cells. Curr Opin Cell Biol. 1998;10:35–44. - PubMed
    1. Jordan MA, Toso RJ, Thrower D, Wilson L. Mechanism of mitotic block and inhibition of cell proliferation by Taxol at low concentrations. Proc Natl Acad Sci U S A. 1993;90:9552–6. - PMC - PubMed
    1. Jordan MA, Wendell K, Gardiner S, Derry WB, Copp H, Wilson L. Mitotic block induced in HeLa cells by low concentrations of paclitaxel (Taxol) results in abnormal mitotic exit and apoptotic cell death. Cancer Res. 1996;56:816–25. - PubMed
    1. Gundersen GG, Cook TA. Microtubules and signal transduction. Curr Opin Cell Biol. 1999;11:81–94. - PubMed
    1. Meek DW. Multisite phosphorylation and the integration of stress signals at p53. Cell Signal. 1998;10:159–66. - PubMed

Publication types

MeSH terms