. 2007 Apr 18;2(4):e374.
doi: 10.1371/journal.pone.0000374.

Evolution of axis specification mechanisms in jawed vertebrates: insights from a chondrichthyan

Affiliations

Evolution of axis specification mechanisms in jawed vertebrates: insights from a chondrichthyan

Marion Coolen et al. PLoS One. .

Abstract

The genetic mechanisms that control the establishment of early polarities and their link with embryonic axis specification and patterning seem to substantially diverge across vertebrates. In amphibians and teleosts, the establishment of an early dorso-ventral polarity determines both the site of axis formation and its rostro-caudal orientation. In contrast, amniotes retain a considerable plasticity for their site of axis formation until blastula stages and rely on signals secreted by extraembryonic tissues, which have no clear equivalents in the former, for the establishment of their rostro-caudal pattern. The rationale for these differences remains unknown. Through detailed expression analyses of key development genes in a chondrichthyan, the dogfish Scyliorhinus canicula, we have reconstructed the ancestral pattern of axis specification in jawed vertebrates. We show that the dogfish displays compelling similarities with amniotes at blastula and early gastrula stages, including the presence of clear homologs of the hypoblast and extraembryonic ectoderm. In the ancestral state, these territories are specified at opposite poles of an early axis of bilateral symmetry, homologous to the dorso-ventral axis of amphibians or teleosts, and aligned with the later forming embryonic axis, from head to tail. Comparisons with amniotes suggest that a dorsal expansion of extraembryonic ectoderm, resulting in an apparently radial symmetry at late blastula stages, has taken place in their lineage. The synthesis of these results with those of functional analyses in model organisms supports an evolutionary link between the dorso-ventral polarity of amphibians and teleosts and the embryonic-extraembryonic organisation of amniotes. It leads to a general model of axis specification in gnathostomes, which provides a comparative framework for a reassessment of conservations both among vertebrates and with more distant metazoans.


Conflict of interest statement

Competing Interests: The authors have declared that no competing interests exist.

Figures

Figure 1
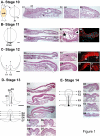
Figure 1. Histological sections of dogfish embryos from stages 10 to 14.
For each stage, a schematic animal view of the embryo is shown on the left, anterior to the top. Dotted lines on this view indicate the level and plane of the sections shown. Sagittal sections are shown with anterior to the left and posterior to the right. Sections A2–A3, B3, C3–C4, C6–C7 are respectively higher magnifications of sections A1, B1, B2, C2, C5. Sections A1–A3, B1–B3, C1–C4, D1–D7, E1–E4 are stained with hematoxylin/eosin. Section B4 shows a high magnification of central posterior margin stained with rhodamine-phalloidin and DAPI. Section C5 is stained with phalloidin. In B3 the arrowhead points to bottle-like cells and the asterix shows the location of elongated cells close to the posterior margin. Scale bar: 500 µm. Abbreviations: ar, archenteron; bl, blastocoele; e, endoderm; m, mesoderm; me, mesendoderm; y, yolk.
Figure 2
Figure 2. Expression of mesoderm regional markers during axis extension.
Animal views of S. canicula embryos after whole-mount in situ hybridization using FoxA2 (a–c), Lim1 (d–f), Wnt8 (g–i), Gata6 (j–l, k'), MafB (m–o) and Bmp4 (p–r) probes. Views are restricted to the territories enclosed in a dotted box on the schemes of the upper panel. In this panel, below the schematic views of embryos, colored bars symbolise the largely exclusive, more and more lateral, expression territories of markers of axial (red), paraxial (purple) and lateral (blue) mesoderm at the posterior margin. A', c', e', f', h', i', l', n', o', r': sections of the embryos shown in a, c, e, f, h, i, l, n, o, r after eosin counterstaining. The planes of sections are indicated by thin lines on the whole-mount view of each embryo. Scale bar: 500 µm.
Figure 3
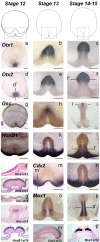
Figure 3. Temporal regulation of embryonic axis formation from rostral to caudal level.
Animal views of S. canicula embryos after in situ hybridization using Otx1 (a–c), Otx2 (d–f), Gsc (g–i), HoxB1 (j–l), Cdx2 (m,n) and Mox1 (o, p) probes. For each probe, stages are indicated in the upper line. The views are focussed on the territories enclosed in dotted boxes in b, c, e, f, h, i, j, k, l, m, n, o, p. d', f', g', i', l', m', p': sections of hybridized embryos shown in d, f, g, i, l, m, p after eosin counterstaining. The planes of sections are indicated by thin lines on the whole-mount view of each embryo. Scale bar: 500 µm.
Figure 4
Figure 4. Molecular characterization of the dogfish embryo at pre-gastrula stages.
A) Animal views of S. canicula embryos after in situ hybridization using Otx1 (a,h), Otx2 (b,i), Otx5 (c,j), FoxA2 (d,k), Lim1 (e,l,m), Gsc (f, n) and Brachyury (g, o) probes at stage 10 (upper line) and 11 (second line) as indicated. h', i', j', k', l', n' and o' are midline sagittal sections through the embryos shown in h, i, j, k, l, n and o respectively. Scale bar: 500 µm. B) Summary of the three main expression territories identified at stage 11 on the basis of gene expression patterns. Left panel: transcript distribution in the upper cell layer of the blastoderm. Right panel: transcript distribution in the lower layer of the posterior overhang. C) Phenotypes of Xenopus embryos injected with dogfish Otx mRNAs. Embryos at four-cell stage were dorsally-injected with 100 pg dogfish Otx mRNA. They were cultured to stage 35 for score of phenotypes. (a) An uninjected embryo. (b) A dogfish Otx1-injected embryo. (c) A dogfish Otx2-injected embryo. (d) A dogfish Otx5-injected embryo. Overexpression of all three dogfish Otx proteins leads to very similar phenotypes. D) Expression of mesoderm and cement gland markers in dogfsih Otx-injected Xenopus embryos. The embryos shown in the second, third and fourth column were respectively injected with 100 pg of dogfish Otx1, Otx2 and Otx5 mRNA, controls are shown in the first column. The embryos hybridized with Xnot2 (first line), chordin (second line) and Xbra (third line) were injected in the dorsal region at the four-cell stage and developed until stage 11, those hybridized with the XCG probe (fourth line) were injected in the ventral region and developed until stage 25. (a) Control embryo showing Xnot2 expression in the dorsal mesoderm. (b, c, d) Injection of dogfish Otx1 (b), Otx2 (c) and Otx5 (d) inhibits Xnot2 expression. (e) Control embryo showing chordin expression. (f, g, h) Injection of dogfish Otx1 (f), Otx2 (g) and Otx5 (h) did not affect chordin expression. (i) Control embryo showing Xbra expression in the entire maginal mesoderm. (j, k, l) Injection of dogfish Otx1 (j), Otx2 (k) and Otx5 (l) inhibits Xbra expression at the sites of injection. (m) Control stage 25 embryo showing XCG1 expression in the cement gland. (n, o, p) Injection of dogfish Otx1 (n), Otx2 (o) and Otx5 (p) strongly induced ectopic XCG1 expression in the ventral region.
Figure 5
Figure 5. Expression profiles of signalling molecules in the dogfish from pre- to early gastrulation stages.
a–n: animal views of dogfish embryos hybridized with Vg1 (a, f, k), Wnt8 (b, g, l), Nodal (c, h, m), Lefty (d, i, n), Bmp4 (e, j, o) probes. f', l', h', n', j' are sagittal sections through the embryos shown in f, l, h, n, j respectively, after eosin counterstaining. The planes of sections are indicated by thin lines on the whole-mount view of each embryo. h” is a higher magnification of h at the level of the posterior margin. Similarly the view in m is restricted to the posterior margin. Scale bar: 500 µm.
Figure 6
Figure 6. Early polarities at blastula stages in the dogfish.
A. a–f: animal views of early dogfish embryos hybridized with Otx5 (a,d) , Bmp4 (b, e) and Nodal (c, f) probes. g: double in situ hybridization using Bmp4 (blue) and Otx5 (brown) probes at stage 9. h: sagittal section through a stage 7/8 dogfish embryo stained with rhodamine-phalloidin (red) and DAPI (blue). At this stage, the embryo consists in a mass of round-shaped cells lying on top of the vitellus. A single layer of elongated cells is visible at the level of the blastocoele roof. Scale bar: 500 µm. B. Abnormal expression of anterior markers in Bmp4 null mutant embryos. Lateral views of wild-type (WT: a, c) and Bmp4tm1Blh/Bmp4tm1Blh (Bmp4-/- :b, d) 6.5 dpc mouse embryos, hybridized with Otx2 (a, b) and Dkk1 (c, d) probes. In Bmp4-/- embryos, Otx2 transcripts are not restricted anteriorly and a distal extension of the Dkk1 territory in the anterior visceral endoderm is visible. e: Higher magnification of the embryo in e, showing the absence of Otx2 transcripts in the distal part. Scale bar: 100 µm.
Figure 7
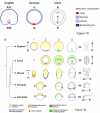
Figure 7. Schemes depicting territory homologies between the dogfish and vertebrate model organisms.
A. Regionalisation of the site of mesoderm internalisation : comparison between the dogfish, xenopus and chick. Axial (red), paraxial (purple) and lateral (light blue) presumptive mesoderm components show the same relative location along the dogfish posterior arms, xenopus marginal ring and chick primitive streak. An additional minor mesoderm cell population, proposed to contribute to extraembryonic blood islands, is also internalised at lateral and anterior levels of the dogfish blastoderm margin (dark blue). We suggest that this cell population may be evolutionary related both to the presumptive ventral mesoderm, located to the ventral part of the marginal ring in xenopus, and extraembryonic mesoderm, internalised at the posterior part of the primitive streak in amniotes. A, anterior; P, posterior; V, ventral; D, dorsal (refer to the nomenclature paragraph in the Materials and methods section for the use of these terms in the manuscript). B. Similarities in the relative organisation of extraembryonic and embryonic territories between the dogfish and amniotes at blastula and early gastrula stages. Columns 1, 2, 3 and 4 show proposed territory homologies between the dogfish and the vertebrate model organisms at early blastula (1), late blastula (2), early gastrula (3) and mid-gastrula (4) stages respectively. A single blastula stage is shown in xenopus and zebrafish, since the conservation of the temporal sequence of gene expression inductions is less clear with these species. At early blastula stages, the dogfish blastoderm shows a partitioning into two territories, which on the basis of Bmp4, Nodal and Otx expressions, can be related to dorsal (orange) and ventral (yellow) territories of early zebrafish or xenopus embryos, as well as to inner cell mass (orange) and trophectoderm (yellow)-derived territories of the mouse egg cylinder. In the dogfish, this early polarity can be aligned with the later antero-posterior axis of the embryo proper (schematised on the right of the figure). At late blastula stages (column 2), homologous dorsal territories (shown in gray) expressing Gsc, Lim1 and Otx are induced at the level of the dogfish posterior margin, chick Koller's sickle, mouse embryonic visceral endoderm. Comparisons between the three species suggest that a posterior expansion of the blastula Bmp4 positive extraembryonic territory has taken place in amniotes (columns 1, 2, 3). Whether a remnant of the site of posterior fusion hypothesized by this evolutionary model (dotted line in columns 2, 3, 4) may persist in amniotes remains an opened question. The early organizer (red) is induced concomitantly with the anterior displacement of the hypoblast/AVE homologs (green, column 3). The site of mesoderm internalisation (column 4) is depicted as in A. Prox., proximal; Dist., distal.

References

    1. Gerhardt J, Kirschner M. Cells, Embryos and Evolution. Oxford, UK: Blackwell Scientific; 1997.
    1. Erwin DH, Davidson EH. The last common bilaterian ancestor. Development. 2002;129:3021–3032. - PubMed
    1. Arendt D. Evolution of eyes and photoreceptor cell types. Int J Dev Biol. 2003;47:563–571. - PubMed
    1. Force A, Lynch M, Pickett FB, Amores A, Yan YL, et al. Preservation of duplicate genes by complementary, degenerative mutations. Genetics. 1999;151:1531–1545. - PMC - PubMed
    1. Locascio A, Manzanares M, Blanco MJ, Nieto MA. Modularity and reshuffling of Snail and Slug expression during vertebrate evolution. Proc Natl Acad Sci U S A. 2002;99:16841–16846. - PMC - PubMed

Publication types