. 2007 Apr 18;2(4):e383.
doi: 10.1371/journal.pone.0000383.

Assessing performance of orthology detection strategies applied to eukaryotic genomes

Affiliations

Assessing performance of orthology detection strategies applied to eukaryotic genomes

Feng Chen et al. PLoS One. .

Abstract

Orthology detection is critically important for accurate functional annotation, and has been widely used to facilitate studies on comparative and evolutionary genomics. Although various methods are now available, there has been no comprehensive analysis of performance, due to the lack of a genomic-scale 'gold standard' orthology dataset. Even in the absence of such datasets, the comparison of results from alternative methodologies contains useful information, as agreement enhances confidence and disagreement indicates possible errors. Latent Class Analysis (LCA) is a statistical technique that can exploit this information to reasonably infer sensitivities and specificities, and is applied here to evaluate the performance of various orthology detection methods on a eukaryotic dataset. Overall, we observe a trade-off between sensitivity and specificity in orthology detection, with BLAST-based methods characterized by high sensitivity, and tree-based methods by high specificity. Two algorithms exhibit the best overall balance, with both sensitivity and specificity>80%: INPARANOID identifies orthologs across two species while OrthoMCL clusters orthologs from multiple species. Among methods that permit clustering of ortholog groups spanning multiple genomes, the (automated) OrthoMCL algorithm exhibits better within-group consistency with respect to protein function and domain architecture than the (manually curated) KOG database, and the homolog clustering algorithm TribeMCL as well. By way of using LCA, we are also able to comprehensively assess similarities and statistical dependence between various strategies, and evaluate the effects of parameter settings on performance. In summary, we present a comprehensive evaluation of orthology detection on a divergent set of eukaryotic genomes, thus providing insights and guides for method selection, tuning and development for different applications. Many biological questions have been addressed by multiple tests yielding binary (yes/no) outcomes but no clear definition of truth, making LCA an attractive approach for computational biology.


Conflict of interest statement

Competing Interests: The authors have declared that no competing interests exist.

Figures

Figure 1
Figure 1. OrthoMCL graph construction between two species, including the establishment of co-ortholog relationships.
Solid lines connecting A1 and B1 represent putative ortholog relationships identified by the ‘reciprocal best hit’ (RBH) rule. Dotted lines (e.g. those connecting A1 with A2 and A3, or B1 with B2) represent putative in-paralog relationships within each species, identified using the ‘reciprocal better hit’ rule. Putative co-ortholog relationships, indicated by dashed gray lines, connect in-paralogs across species boundaries (e.g. A3 and B2).
Figure 2
Figure 2. Agreement/disagreement between prediction results of seven orthology detection methods.
Average counts of protein pairs identified in 100 sampling replicates are shown (top; note log scale), for each of the 128 (27) possible orthology prediction patterns indicated by filled and empty boxes (bottom), representing positive and negative orthology predictions, respectively.
Figure 3
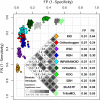
Figure 3. False positive and false negative rates for multiple orthology/homology detection methods.
Shaded diamonds present bivariate residual (BVR) statistics calculated based on the orthology data (see Figure 2) and the 2LC model, showing conditional dependence between the ten methods under study. For benchmarking purpose, the CFactor 2LC model is applied to all orthology detection methods to correct for these dependencies (see Figure S2). FP and FN estimates for each method and the overall orthology probability (estimated to be 0.48) are calculated based on the average frequency table from 100 sampling replicates. Those replicates exhibiting a good fit to the CFactor 2LC model (L-square<170) are plotted as colored circles (for illustrative purposes only; FP and FN rates in the table are based on all replicates).
Figure 4
Figure 4. The effects of parameter alteration on orthology detection performance.
Panel A: Phylogeny-based methods. Varying the orthology bootstrap cutoff indicates that the cross-over point where FP = FN occurs at a lower cutoff than the suggested default (50%; gray bar). Panel B: BLAST-based methods. The effect of changing E-value cutoff for various methods (the bit score cutoff used by Inparanoid is transformed into E-value cutoff) is shown. Single data point is provided for KOG, which could not be readily rerun under diverse conditions. Panel C: Markov clustering methods. The effect of varying the MCL inflation index is shown. The inflation index of 1 corresponds to single-linkage (SL) clustering. In panels A–C, FP and FN error rates are represented by solid and dashed lines, respectively. Panel D: An ROC curve representing the range of FP and FN error rates observed in panels A & B. Default or recommended settings for each method are indicated by circles.
Figure 5
Figure 5. Comparison of protein domain content similarity for OrthoMCL and KOG groups.
The distribution of Domain Content Similarity (DCS) values for non-identical KOG and OrthoMCL groups is shown. Shading is used to represent group size (number of taxa). In general, OrthoMCL groups are smaller, and exhibit more consistency in protein domain architecture.
Figure 6
Figure 6. Example of KOG vs OrthoMCL clustering.
Group KOG2550 is split by OrthoMCL into two groups that are more consistent with respect to both EC annotation and protein domain architecture. Panel A: Edge lengths in these two BioLayout graphs indicate BLAST similarity relationships, and node colors represent different OrthoMCL groups (note that one protein, shown in gray, is not clustered by OrthoMCL). OrthoMCL uses normalized BLAST scores , and clustering is based on the identification of (co-)orthologs and in-paralogs (Figure 1), rather than simply homologs defined by BLAST. Panel B: Colored vertical bars correspond to OrthoMCL groups; colored horizontal bars indicate conserved domains assigned by MKDOM2 .

References

    1. Fitch WM. Distinguishing homologous from analogous proteins. Syst Zool. 1970;19:99–113. - PubMed
    1. Fitch WM. Homology, a personal view on some of the problems. Trends Genet. 2000;16:227–231. - PubMed
    1. Doolittle RF. The multiplicity of domains in proteins. Annu Rev Biochem. 1995;64:287–314. - PubMed
    1. Koonin EV. Orthologs, paralogs, and evolutionary genomics. Annu Rev Genet. 2005;39:309–338. - PubMed
    1. Remm M, Storm CE, Sonnhammer EL. Automatic clustering of orthologs and in-paralogs from pairwise species comparisons. J Mol Biol. 2001;314:1041–1052. - PubMed

Publication types