. 2007 Jul;102(2):466-78.
doi: 10.1111/j.1471-4159.2007.04595.x. Epub 2007 Apr 17.

A glycogen phosphorylase inhibitor selectively enhances local rates of glucose utilization in brain during sensory stimulation of conscious rats: implications for glycogen turnover

Affiliations

A glycogen phosphorylase inhibitor selectively enhances local rates of glucose utilization in brain during sensory stimulation of conscious rats: implications for glycogen turnover

Gerald A Dienel et al. J Neurochem. 2007 Jul.

Abstract

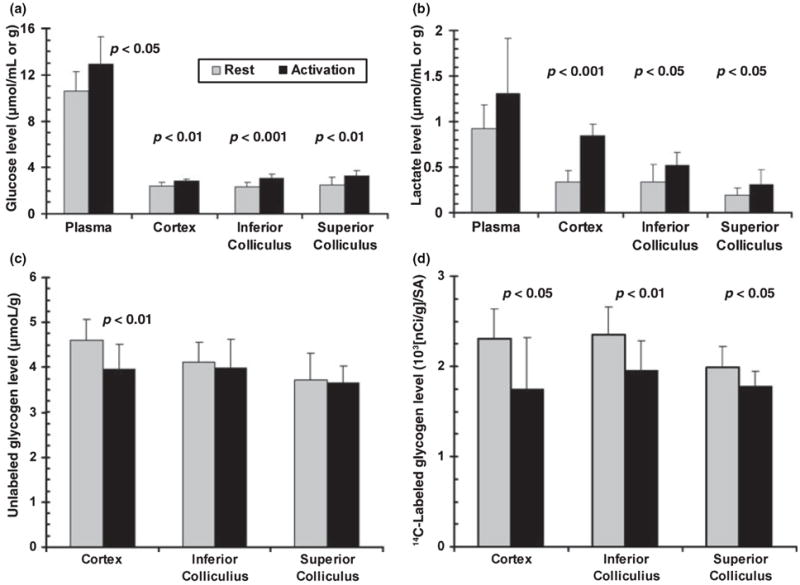
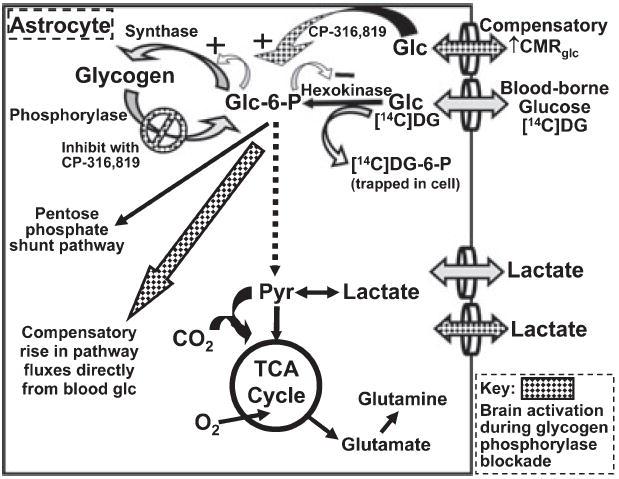
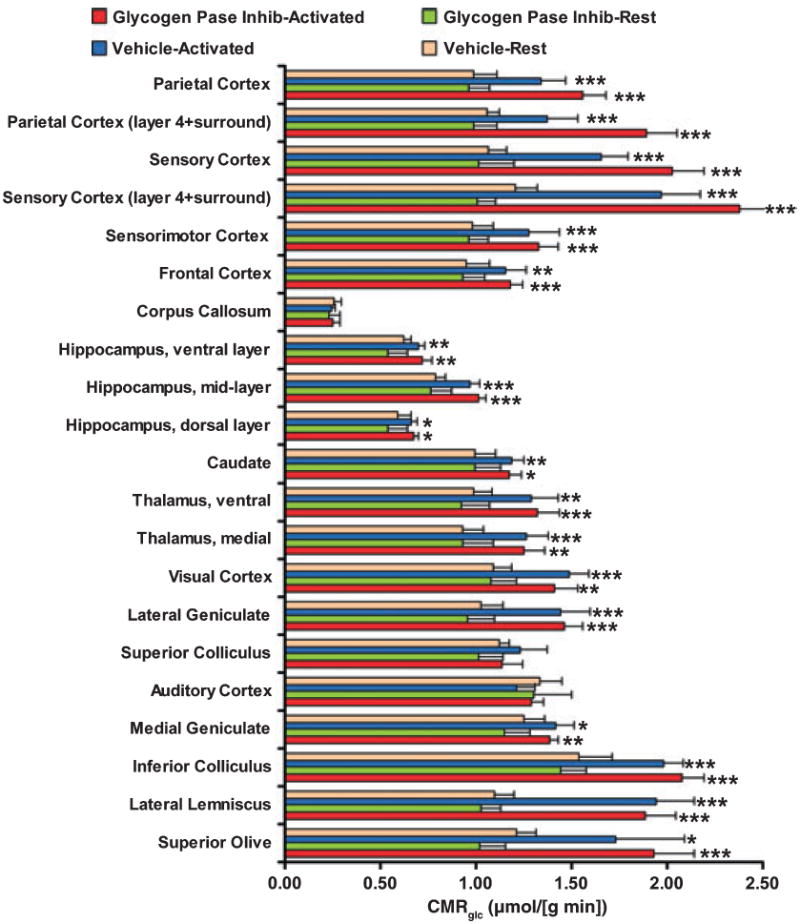
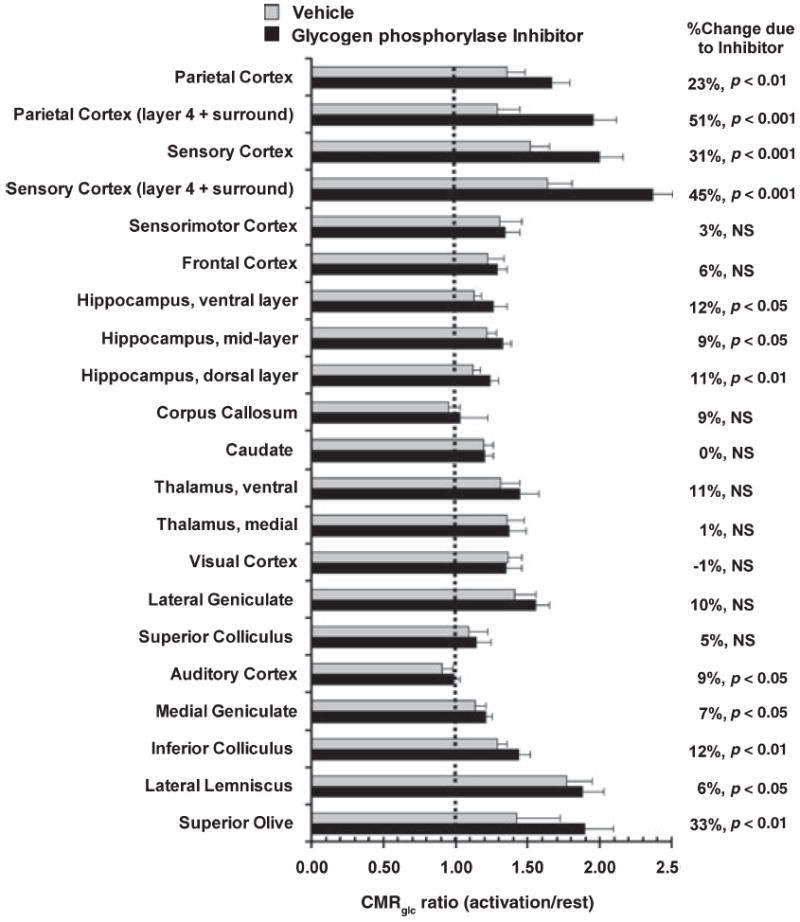
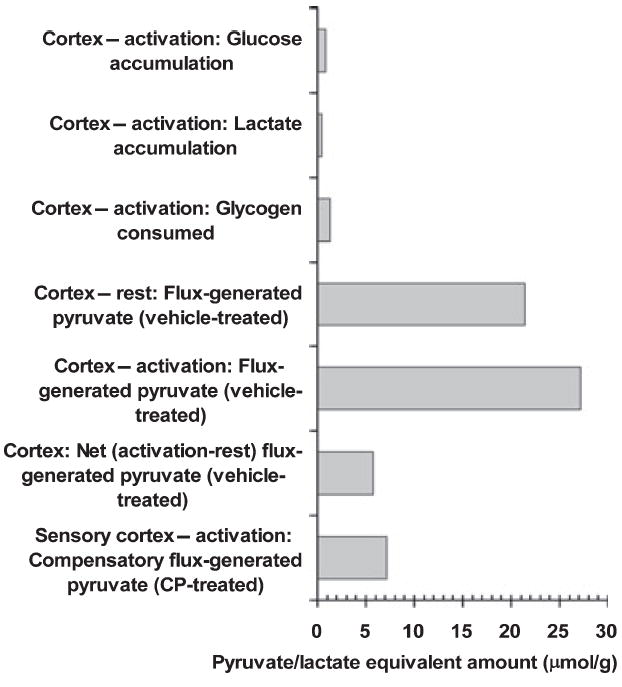
Glycogen is degraded during brain activation but its role and contribution to functional energetics in normal activated brain have not been established. In the present study, glycogen utilization in brain of normal conscious rats during sensory stimulation was assessed by three approaches, change in concentration, release of (14)C from pre-labeled glycogen and compensatory increase in utilization of blood glucose (CMR(glc)) evoked by treatment with a glycogen phosphorylase inhibitor. Glycogen level fell in cortex, (14)C release increased in three structures and inhibitor treatment caused regionally selective compensatory increases in CMR(glc) over and above the activation-induced rise in vehicle-treated rats. The compensatory rise in CMR(glc) was highest in sensory-parietal cortex where it corresponded to about half of the stimulus-induced rise in CMR(glcf) in vehicle-treated rats; this response did not correlate with metabolic rate, stimulus-induced rise in CMR(glc) or sequential station in sensory pathway. Thus, glycogen is an active fuel for specific structures in normal activated brain, not simply an emergency fuel depot and flux-generated pyruvate greatly exceeded net accumulation of lactate or net consumption of glycogen during activation. The metabolic fate of glycogen is unknown, but adding glycogen to the fuel consumed during activation would contribute to a fall in CMR(O2)/CMR(glc) ratio.


Figures

Fig. 1
Fig. 1
Sensory stimulation activates glycogenolysis and increases regional glucose and lactate levels in brain. Stimulus-induced changes in plasma (μmol/mL) and brain (μmol/g wet wt.) glucose (a) and lactate (b) level, brain glycogen content (c) and 14C-labeled brain glycogen (d) were determined at 10 min after onset of visual (16 Hz on–off flashing light), acoustic (95 dB broadband tone) and generalized sensory stimulation (gentle brushing of the whiskers and body) of conscious rats. Brain metabolite levels were assayed in tissue extracts. Glycogen turnover was determined as 14C retained in glycogen after pre-labeling with [1-14C]glucose for 30 min prior to stimulation; the [14C]glycogen level in each rat was normalized by dividing by the time-activity integral of arterial plasma glucose for that animal (ISA = integrated specific activity); see Materials and methods. Values are means; vertical bars = 1 SD (n = 9/group). Statistically significant differences between activation and rest were identified with the t-test.
Fig. 2
Fig. 2
Compensatory increase in glucose utilization in astrocytes during sensory stimulation with blockade of glycogen phosphorylase. Schematic diagram of glucose metabolic pathways illustrating the three major pathways for utilization of glucose-6-phosphate (glc-6-P) in astrocytes: the glycolytic pathway to form pyruvate, the pentose phosphate shunt pathway to generate NADPH and pentose phosphates (most of which re-enter the glycolytic pathway after transformation by the transketolase/transaldolase reactions) and the glycogen pathway (for more details, see Hertz et al. 2007). Note that glc-6-P feedback inhibits hexokinase (negative sign) and activates the glycogen synthesis pathway (plus sign). Inhibition of glycogen phosphorylase with CP-316,819 during brain activation renders blood glucose the sole source for glc-6-P via the hexokinase reaction, which is specifically measured with the [14C]deoxyglucose (DG) method (see text). CP-316,819-induced compensatory changes in utilization of blood-borne glucose (hatched symbols) at the hexokinase step are quantified by means of changes in the rate of [14C]DG phosphorylation, from which rates of glucose utilization are calculated.
Fig. 3
Fig. 3
Sensory stimulation increases local rates of glucose utilization (CMRglc) in many brain structures. Rats were pre-treated with the glycogen phosphorylase inhibitor, CP-316,819 (the abbreviation Pase Inhib denotes phosphorylase inhibitor), or an equal volume of vehicle and CMRglc assayed during a 30-min interval of rest or activation. Acoustic plus generalized sensory stimulation commenced with the pulse intravenous injection of [14C]deoxyglucose and continued throughout the 30-min experimental interval. CMRglc in regions of cerebral cortex corresponds to all laminae; in parietal and sensory cortex, layer 4 plus the immediately adjacent tissue was also assayed (Zilles and Wree 1995). The dorsal hippocampal layer includes the alveus, oriens, pyramidal and radiatum layers of dorsal CA1 hippocampus; the mid-layer includes the lacunosum-molecular layer of CA1 sector plus the molecular layer of the external limb of dentate gyrus; and the ventral layer includes the multiform layers of the external limb plus granular and molecular layers of the internal limb (Beck et al. 1990). Values are means; bars = 1 SD (n = 6/group). Statistically significant differences between activated and resting groups: *p < 0.05; **p < 0.01; ***p < 0.001; t-test.
Fig. 4
Fig. 4
Differential activation of CMRglc in functional pathways during glycogenolysis blockade. The relative change in CMRglc during stimulation compared with rest in the same treatment group (vehicle- and CP-316,819-treated) was calculated from data shown in Fig. 3 by dividing each value for stimulated rats by the respective mean value for resting CMRglc for that structure in that group. Values are mean ratios (bars = 1 SD); ratios > 1.0 indicate activation due to sensory stimulation. Statistically significant differences between ratios for each structure in CP-316,819- compared with vehicle-treated rats were identified with the t-test after logarithic transformation of the ratio data (Zar 1974).
Fig. 5
Fig. 5
Comparison of flux-generated pyruvate/lactate with net concentration change. The amount of pyruvate generated in cerebral cortex via flux of blood-borne glucose through the glycolytic pathway during a 10-min interval was calculated from the arithmetic mean CMRglc of measured values in all six cerebral cortical structures during rest (1.07 ± 0.13 μmol glucose/[g min]) and stimulation 1.36 ± 0.19 μmol glucose/(g min) in vehicle-treated rats (Fig. 3); there was an overall 27% increase (p < 0.05) due to activation. During rest, pyruvate equivalents generated from flux of glucose = 1.07 μmol glucose/(g min) × 10 min × 2 pyruvate/glucose = 21.4. Compensatory increases in CMRglc induced by the glycogen phosphorylase inhibitor were calculated as the difference in the mean activated CMRglc in CP-316,819-treated rats minus that in activated vehicle-treated rats [i.e. 0.22, 0.52, 0.37 and 0.41 μmol/(g min) for overall parietal cortex, parietal layer 4, sensory cortex and sensory layer 4, respectively] and pyruvate equivalents were calculated by multiplying by 20, as described above. Because the value for sensory cortex approximates the mean value for all four regions, this representative structure was plotted. Net changes in brain cerebral cortical concentrations of glucose, lactate and glycogen during the 10-min stimulation (Fig. 1) are expressed as triose equivalents (1 glucose = 2 pyruvate/ lactate).

References

    1. Ackermann RF, Lear JL. Glycolysis-induced discordance between glucose metabolic rates measured with radiolabeled fluorodeoxyglucose and glucose. J Cereb Blood Flow Metab. 1989;9:774–785. - PubMed
    1. Beck T, Wree A, Schleicher A. Glucose utilization in rat hippocampus after long-term recovery from ischemia. J Cereb Blood Flow Metab. 1990;10:542–549. - PubMed
    1. sBielajew C, Konkle AT, Merali Z. The effects of chronic mild stress on male Sprague-Dawley and Long Evans rats: I. Biochemical and physiological analyses. Behav Brain Res. 2002;136:583–592. - PubMed
    1. Bielajew C, Konkle AT, Kentner AC, Baker SL, Stewart A, Hutchins AA, Santa-Maria Barbagallo L, Fouriezos G. Strain and gender specific effects in the forced swim test: effects of previous stress exposure. Stress. 2003;6:269–280. - PubMed
    1. Brown AM. Brain glycogen re-awakened. J Neurochem. 2004;89:537–552. - PubMed

Publication types

MeSH terms