. 2007 Apr 18;27(16):4261-72.
doi: 10.1523/JNEUROSCI.0003-07.2007.

Thalamocortical Up states: differential effects of intrinsic and extrinsic cortical inputs on persistent activity

Affiliations

Thalamocortical Up states: differential effects of intrinsic and extrinsic cortical inputs on persistent activity

Pavlos Rigas et al. J Neurosci. .

Abstract

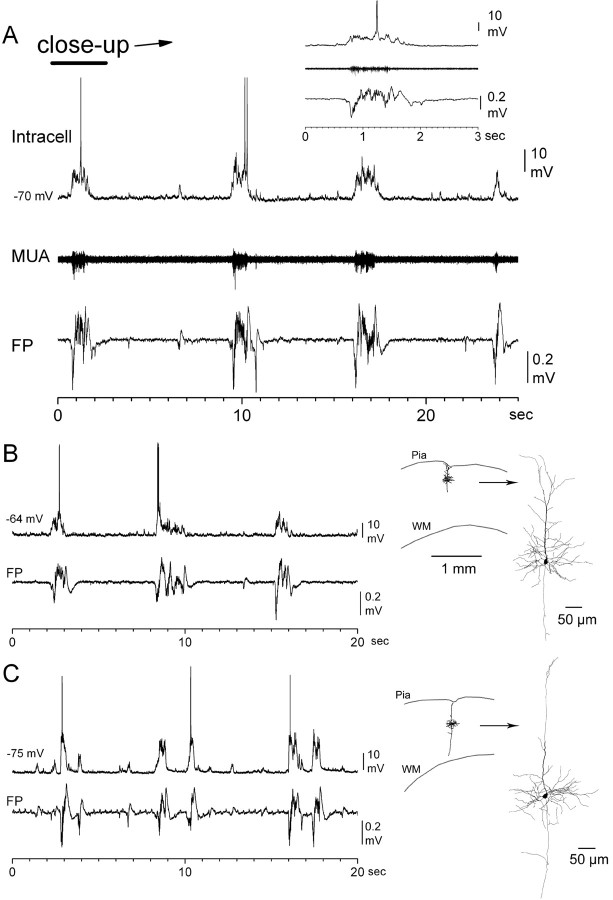
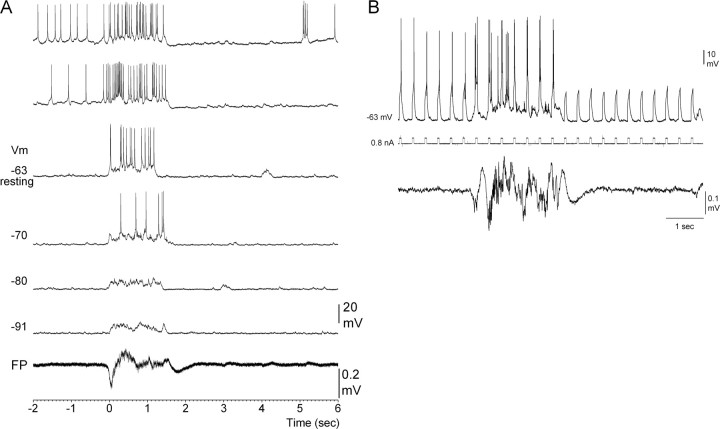
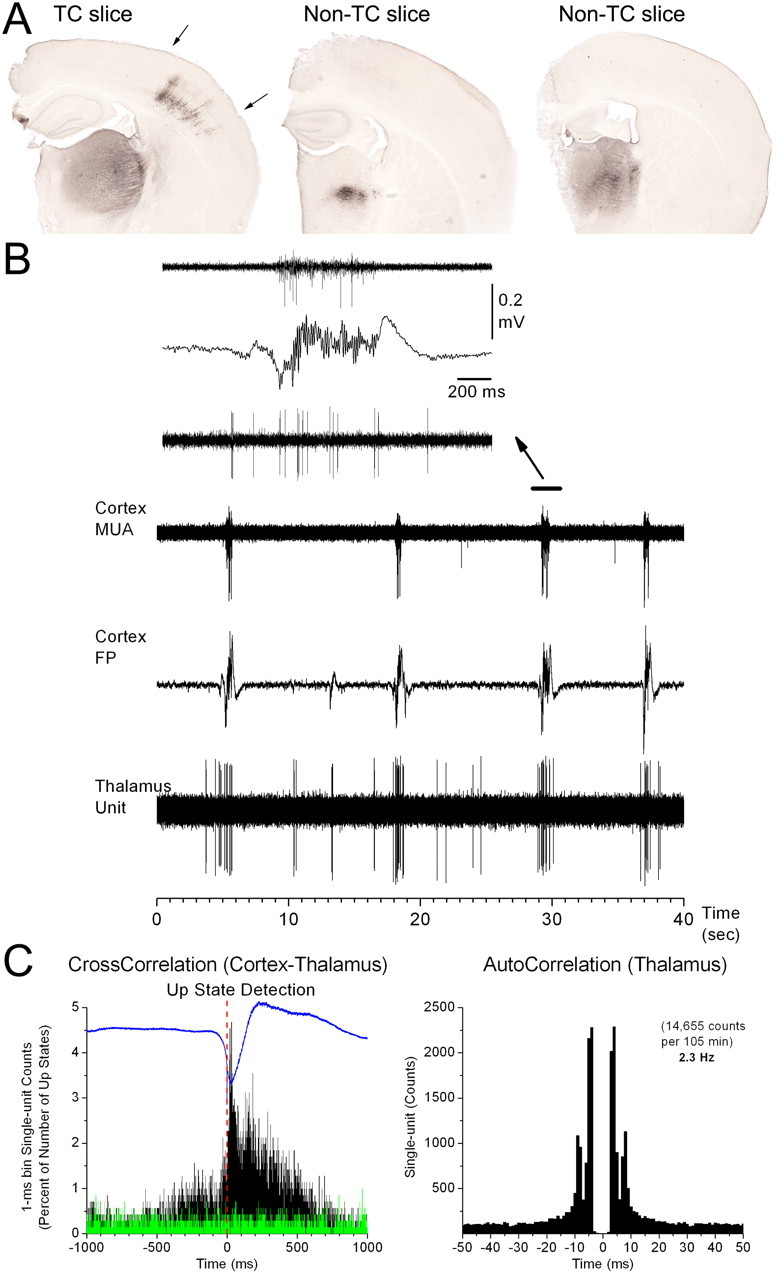
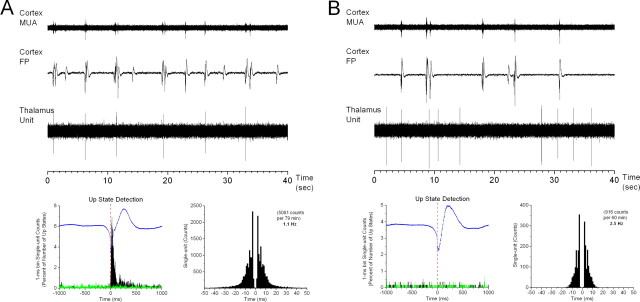
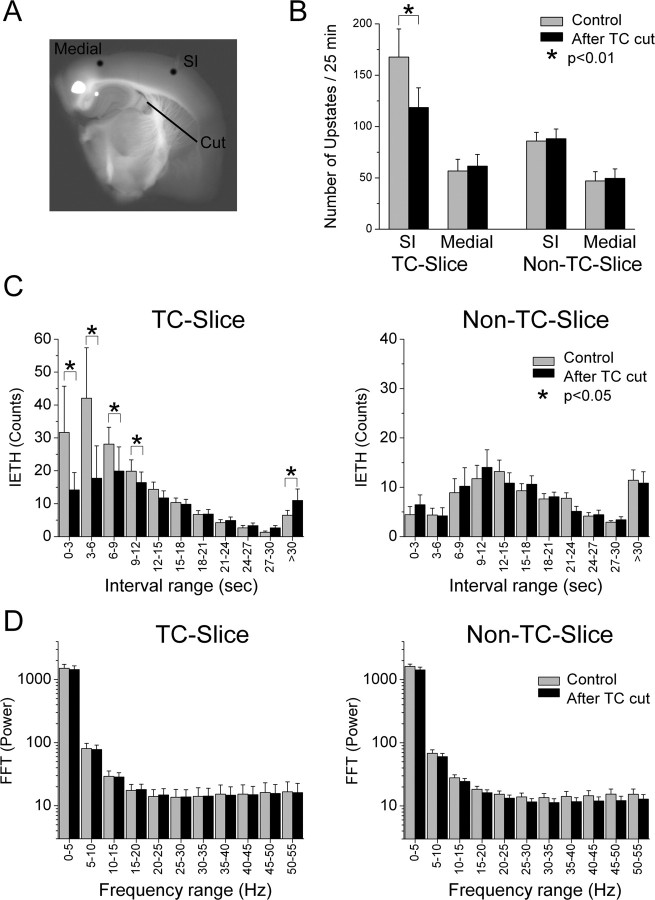
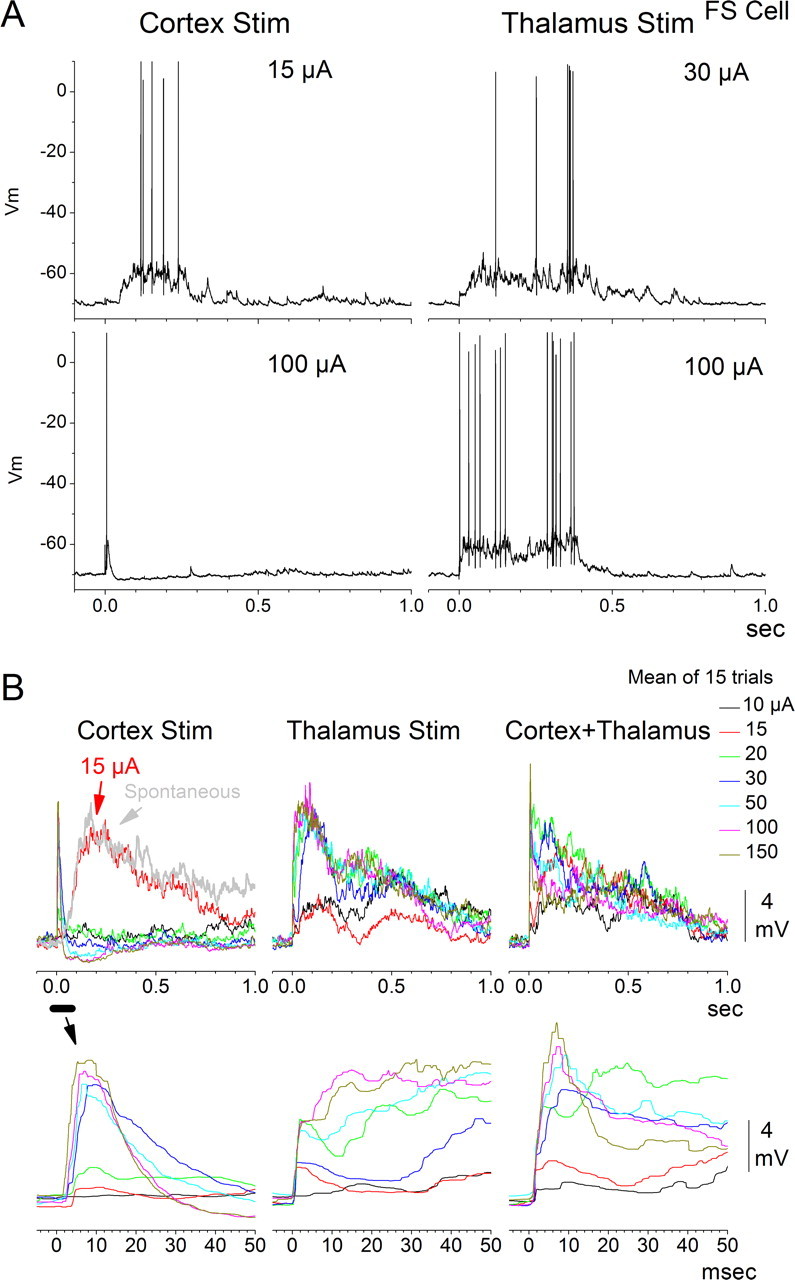
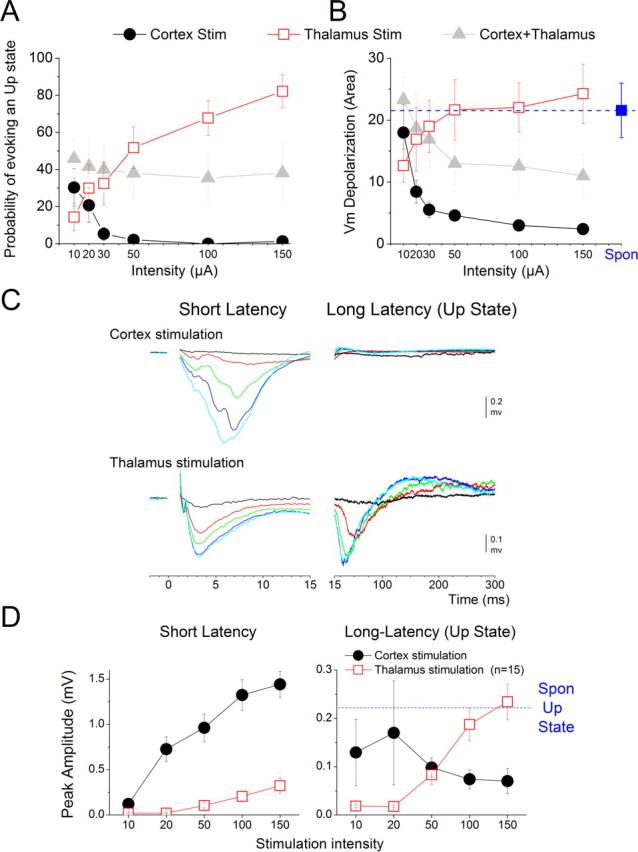
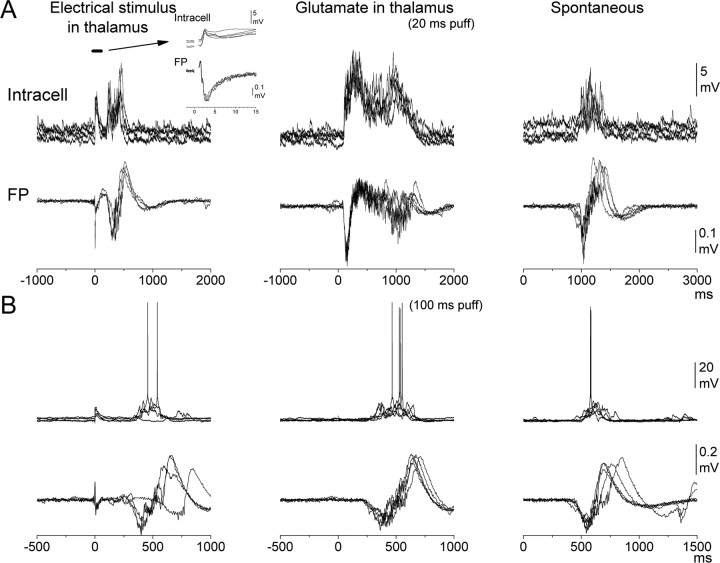
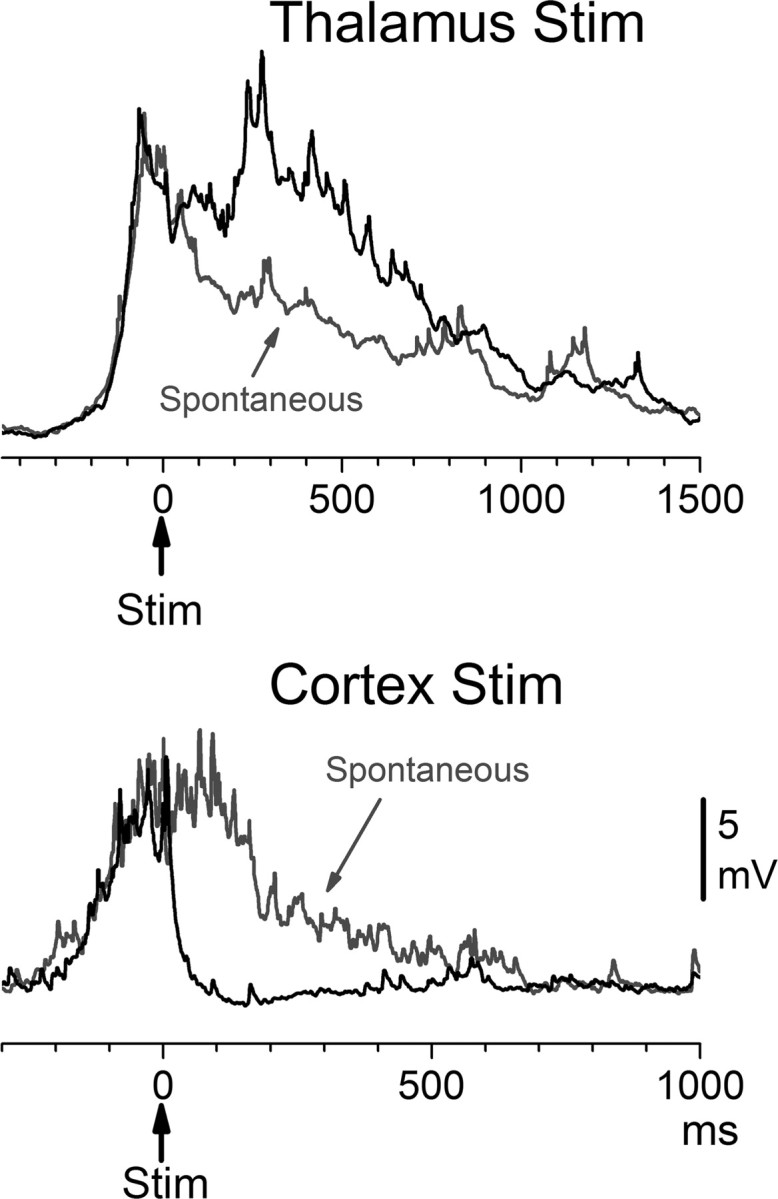
During behavioral quiescence, the neocortex generates spontaneous slow oscillations that consist of Up and Down states. Up states are short epochs of persistent activity that resemble the activated neocortex during arousal and cognition. Although Up states are generated within the cortex, the impact of extrinsic (thalamocortical) and intrinsic (intracortical) inputs on the persistent activity is not known. Using thalamocortical slices, we found that the persistent cortical activity during spontaneous Up states effectively drives thalamocortical relay cells through corticothalamic connections. However, thalamic activity can also precede the onset of cortical Up states, which suggests a role of thalamic activity in triggering cortical Up states through thalamocortical connections. In support of this hypothesis, we found that cutting the connections between thalamus and cortex reduced the incidence of spontaneous Up states in the cortex. Consistent with a facilitating role of thalamic activity on Up states, electrical or chemical stimulation of the thalamus triggered cortical Up states very effectively and enhanced those occurring spontaneously. In contrast, stimulation of the cortex triggered Up states only at very low intensities but otherwise had a suppressive effect on Up states. Moreover, cortical stimulation suppressed the facilitating effect of thalamic stimulation on Up states. In conclusion, thalamocortical inputs facilitate and intracortical inputs suppress cortical Up states. Thus, extrinsic and intrinsic cortical inputs differentially regulate persistent activity, which may serve to adjust the processing state of thalamocortical networks during behavior.


Figures

Figure 1.
Figure 1.
Spontaneous slow oscillations in SI cortex. A, Typical spontaneous Up and Down states observed with intracellular (whole-cell) and extracellular (population) recordings from layer IV–III in SI cortex of thalamocortical slices. The extracellular recording was low-pass (bottom trace) and high-pass (middle trace) filtered to reveal field potential (FP) and multiunit activity (MUA), respectively. B, C, Typical activity observed in two other slices in which the intracellular recorded cells were labeled and reconstructed. WM, White matter.
Figure 2.
Figure 2.
Spontaneous Up and Down states recorded at different membrane potentials. A, Spontaneous Up states recorded from one cell at different membrane potentials produced by the injection of direct current. The top two traces correspond to the injection of positive current into the cell, whereas the bottom three intracellular traces correspond to the injection of negative current. Also shown at bottom is the average field potential (FP) recording corresponding to the six intracellular traces shown. B, Example of the effect of short depolarizing current pulses (50 ms) before, during, and after the Up state. Note the absence of action potentials after the Up state. The simultaneously recorded FP corresponding to the intracellular trace is also shown in the bottom trace.
Figure 3.
Figure 3.
Spontaneous Up states in thalamocortical slices. A, Effect of bulk iontophoresis injection of neurobiotin in the VB thalamus in three consecutive slices from the same animal. The left slice (TC slice) is the only one that showed labeling in the cortex. In particular, many corticothalamic cells were retrogradely labeled in layer VI of SI, indicating the presence of intact corticothalamic fibers between SI cortex and VB thalamus. The middle and right slices (non-TC slices) did not reveal any labeling in the cortex, indicating that connections between the thalamus and cortex had been severed in these slices. The three sections shown correspond to 80 μm cryostat sections taken from the middle of each of the three consecutive 400 μm slices. The left slice is the most posterior of the three. B, Simultaneous extracellular [field potential (FP) and multiunit activity (MUA)] recordings from layers IV–III of SI cortex and single-unit recording from the VB thalamus of a TC slice during spontaneous Up states. Note the firing of the VB thalamocortical cell in relation to the cortical Up states. C, Cross-correlation between the cortical Up state and the VB thalamocortical cell (left). The autocorrelation of the VB cell activity is also shown (right). The correlograms were calculated using continuous spontaneous activity obtained during 105 min. This represents an average 2.3 Hz firing rate for the VB cell. The onset of the cortical Up state was taken as the reference marker (red dashed line) time stamp for the cross-correlation. The cross-correlation overlaid in green is shifted, representing spurious correlations. Overlaid (blue trace) on the cross-correlation is the average field potential of the detected Up states.
Figure 4.
Figure 4.
A, B, Additional cross-correlation examples. Specific details for each panel are the same as for Figure 3. The example in A corresponds to a TC slice, whereas the example in B corresponds to a non-TC slice.
Figure 5.
Figure 5.
Population data showing the average (mean ± SD) cross-correlation between cortical Up states and VB thalamocortical cells in TC slices that showed a significant cross-correlation (above a shifted cross-correlation) between the cortical and thalamic activities (n = 8 slices). The dashed gray box represents the interval that revealed a significant cross-correlation in different slices.
Figure 6.
Figure 6.
Effects of disconnecting the thalamus from the cortex on cortical Up states. A, Photomicrograph of a TC slice preparation taken in the recording chamber showing the simultaneous recording sites in SI cortex (SI) and non-SI cortex (Medial) and the location at which a cut was made in the thalamic radiation to interrupt the connections between thalamus and cortex. B, Effect of a thalamic radiation cut on the incidence of Up states in the SI cortex and in the simultaneously recorded medial non-SI cortex of both TC and non-TC slices. C, IETHs of the spontaneous Up states in SI cortex of TC and non-TC slices before and after a cut of the thalamic radiation. D, Power spectrum FFT analysis of the spontaneous Up states in SI cortex of TC and non-TC slices before and after a cut of the thalamic radiation. Error bars represent SD.
Figure 7.
Figure 7.
Effect of thalamus and/or cortex electrical stimulation (Stim) at different intensities on triggering cortical Up states. A, Examples of single-trial responses of an FS cell to thalamus and cortex stimulation at different intensities. B, Average of intracellular responses to thalamus, cortex, or cortex+thalamus stimulation at different intensities. Each trace is the average of 15 trials, and the action potentials were removed with a median filter. Overlaid in the left panel is the average of 15 spontaneous Up states for comparison (light gray trace). Bottom, Close-up of the top showing the short-latency responses.
Figure 8.
Figure 8.
Population data of I/O curves of thalamus and cortex stimulation (Stim) on Up states. A, Probability of triggering a cortical Up state in response to thalamus stimulation, cortex stimulation, or both together as a function of the stimulation intensity. B, Area of depolarization above the baseline membrane potential (prestimulus V m) for intracellular recordings as a function of the stimulation intensity in thalamus, cortex or both together. Also shown for comparison is the area of depolarization produced by spontaneous Up states in the same experiments (Spon; blue symbol). C, Example of field potential traces evoked by thalamus or cortex stimulation at different intensities. Each trace is the average of 20 trials at 10, 20, 50, 100, and 150 μA. The left shows the short-latency response and the right shows the long-latency response, which reflects the Up state. D, Peak amplitude of short- and long-latency responses evoked by thalamus or cortex stimulation at different intensities. The average amplitude of spontaneous Up states is shown as a blue dashed line in the right panel for comparison with the evoked long-latency responses. Error bars represent SD.
Figure 9.
Figure 9.
Cortical Up states triggered by chemical stimulation of the thalamus. A, Simultaneous intracellular and field potential (FP) recordings from layer IV–III of SI cortex. The panels overlay individual trial responses evoked by electrical stimulation of the thalamus (left), glutamate puffs in the thalamus (middle), or spontaneous Up states (right). Five trials are overlaid per panel. The stimulus onset is at zero. The glutamate puffs were 20 ms in duration. The left panel also shows a close-up of the short-latency response evoked by electrical stimulation of the thalamus (inset). B, Same as in A for a different experiment. The glutamate puffs were 100 ms in duration.
Figure 10.
Figure 10.
Effects of thalamic or cortical electrical stimulation (Stim) during Up states. Intracellular recordings showing the average depolarization of 30 detected spontaneous Up states (dark gray traces) and the average depolarization of the same number of spontaneous Up states affected by thalamus stimulation (top, black trace) or cortex stimulation (bottom, black trace) delivered during the Up state. The stimulus onset is at zero. Action potentials were removed with a median filter. The bottom and top show different cells.

Similar articles

Cited by

References

    1. Agmon A, Connors BW. Thalamocortical responses of mouse somatosensory (barrel) cortex in vitro. Neuroscience. 1991;41:365–379. - PubMed
    1. Alonso JM, Usrey WM, Reid RC. Precisely correlated firing in cells of the lateral geniculate nucleus. Nature. 1996;383:815–819. - PubMed
    1. Anderson J, Lampl I, Reichova I, Carandini M, Ferster D. Stimulus dependence of two-state fluctuations of membrane potential in cat visual cortex. Nat Neurosci. 2000;3:617–621. - PubMed
    1. Benshalom G, White EL. Quantification of thalamocortical synapses with spiny stellate neurons in layer IV of mouse somatosensory cortex. J Comp Neurol. 1986;253:303–314. - PubMed
    1. Bezdudnaya T, Cano M, Bereshpolova Y, Stoelzel CR, Alonso JM, Swadlow HA. Thalamic burst mode and inattention in the awake LGNd. Neuron. 2006;49:421–432. - PubMed

LinkOut - more resources