. 2007 Apr 18;27(16):4452-9.
doi: 10.1523/JNEUROSCI.0134-07.2007.

Suppressed neuronal activity and concurrent arteriolar vasoconstriction may explain negative blood oxygenation level-dependent signal

Affiliations

Suppressed neuronal activity and concurrent arteriolar vasoconstriction may explain negative blood oxygenation level-dependent signal

Anna Devor et al. J Neurosci. .

Abstract

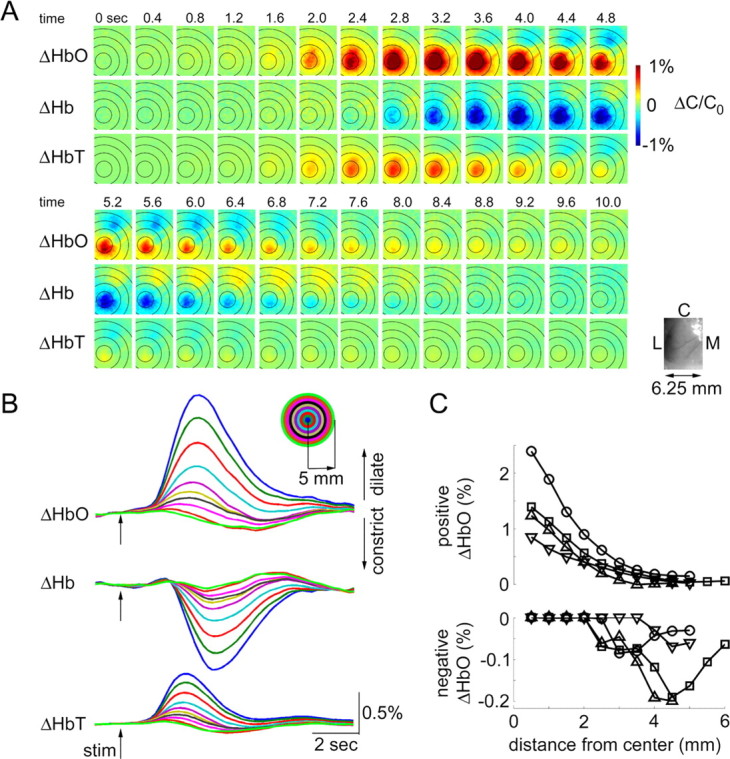
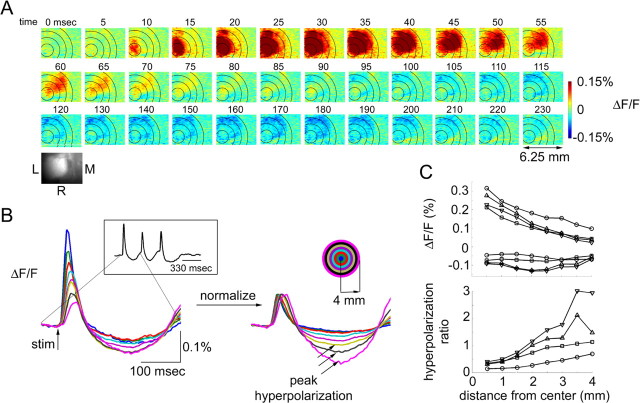
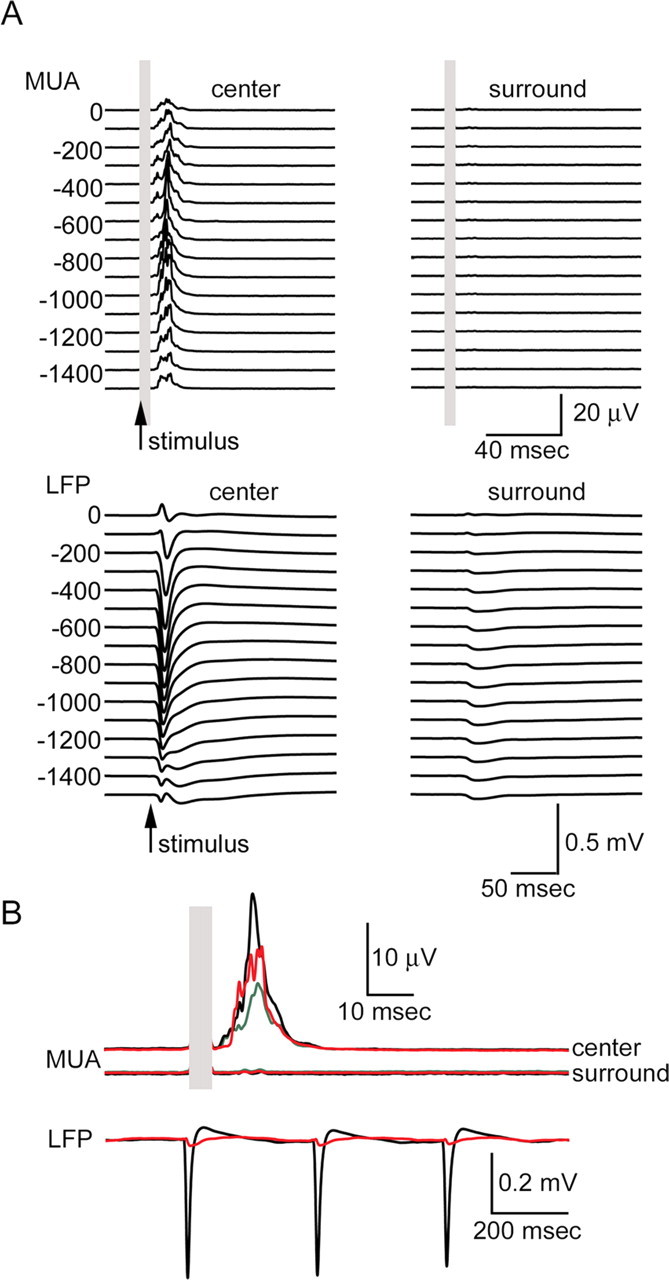
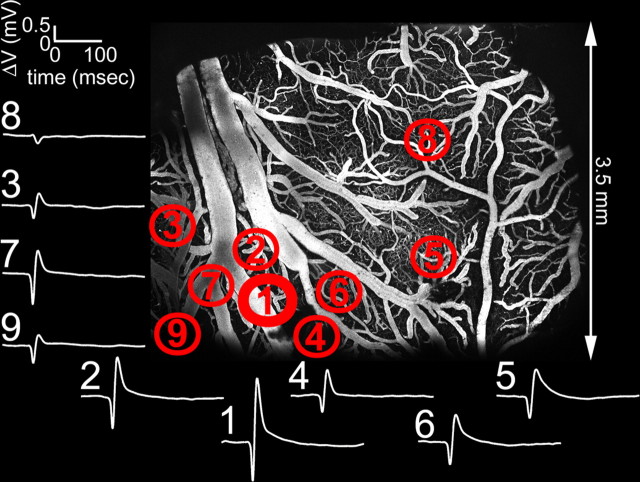
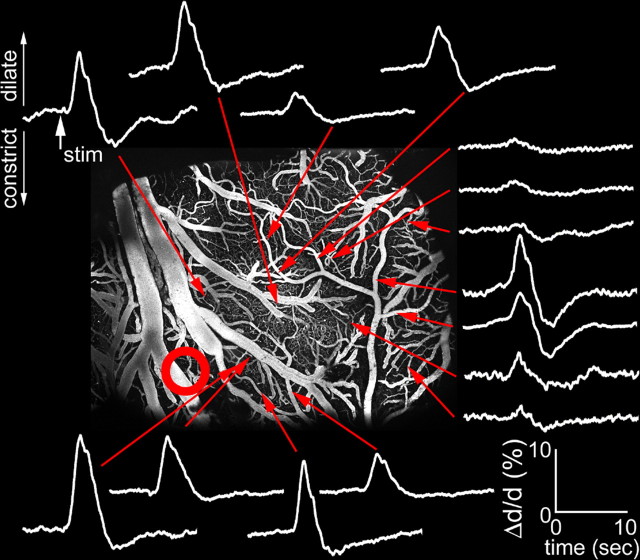
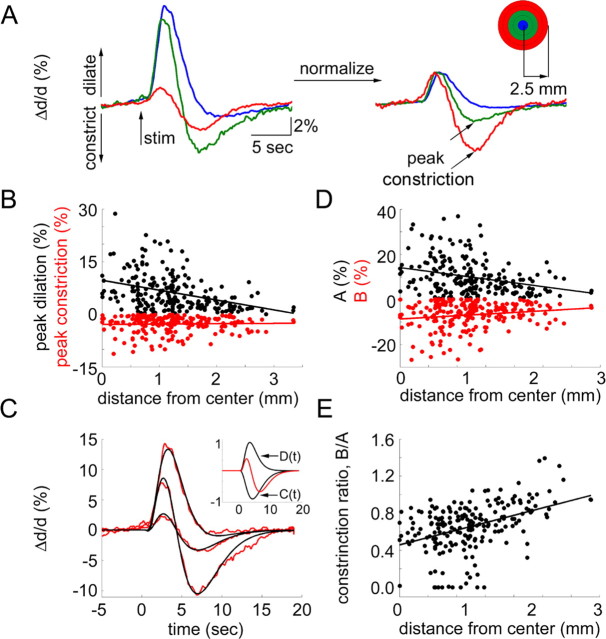
Synaptic transmission initiates a cascade of signal transduction events that couple neuronal activity to local changes in blood flow and oxygenation. Although a number of vasoactive molecules and specific cell types have been implicated, the transformation of stimulus-induced activation of neuronal circuits to hemodynamic changes is still unclear. We use somatosensory stimulation and a suite of in vivo imaging tools to study neurovascular coupling in rat primary somatosensory cortex. Our stimulus evoked a central region of net neuronal depolarization surrounded by net hyperpolarization. Hemodynamic measurements revealed that predominant depolarization corresponded to an increase in oxygenation, whereas predominant hyperpolarization corresponded to a decrease in oxygenation. On the microscopic level of single surface arterioles, the response was composed of a combination of dilatory and constrictive phases. Critically, the relative strength of vasoconstriction covaried with the relative strength of oxygenation decrease and neuronal hyperpolarization. These results suggest that a neuronal inhibition and concurrent arteriolar vasoconstriction correspond to a decrease in blood oxygenation, which would be consistent with a negative blood oxygenation level-dependent functional magnetic resonance imaging signal.


Figures

Figure 1.
Figure 1.
Spectroscopic imaging of blood oxygenation. A, Spatiotemporal evolution of HbO, Hb, and HbT signal change (ΔHbO, ΔHb, ΔHbT) in response to the forepaw stimulus. Time (in seconds) relative to stimulus onset (t = 0) is indicated above images. The time series from the top continues on the bottom. One hundred and fifty trials were averaged. The images were spatially smoothed using a Gaussian kernel of 120 μm full width at e−1 of peak amplitude. The color scale is expressed in percentage of change from the baseline (ΔC/C0). We assumed baseline concentrations of 60 and 40 μm for HbO and Hb, respectively. An image of raw vasculature corresponding to functional frames is shown in lower left corner. L, Lateral; M, medial; C, caudal. B, Signal time courses extracted from 0.5 mm concentric rings around the center of the response. The center was estimated using the earliest HbT response. The rings are superimposed on images in A. Every other ring is shown. The inset shows the color code. C, Peak positive (top) and peak negative (bottom) HbO signal change as a function of distance from the center. Data from four animals are superimposed (circles, squares, upward triangles, and downward triangles).
Figure 2.
Figure 2.
Voltage-sensitive dye measurements of neuronal activity. A, Spatiotemporal evolution of VSD signal in response to the first of the three stimuli in a train. Time (in milliseconds) relative to stimulus onset (t = 0) is indicated above images. One hundred trials were averaged. The images were spatially smoothed using a Gaussian kernel of 120 μm full width at e−1 of peak amplitude. The color scale is expressed as fluorescence percentage change relative to the baseline (ΔF/F). An image of raw vasculature corresponding to functional frames is shown in the lower right corner. L, Lateral; M, medial; R, rostral. B, Signal time courses extracted from 0.5 mm concentric rings around the center of the response. The center was estimated using the earliest response (t = 10 ms). The signal time course in response to the first stimulus in a train of three is shown (see inset on the left). The rings are superimposed on images in A. Every other ring is shown. In the right panel, the initial depolarization for each ring is normalized to 0.1%. Black arrows label peak hyperpolarization. The inset on the right shows the color code. C, Peak depolarization and hyperpolarization (top) and the hyperpolarization ratio (bottom; see Results) as a function of distance from the center. Data from four animals are superimposed (circles, squares, upward triangles, and downward triangles).
Figure 3.
Figure 3.
Laminar array recordings of MUA and LFP. A, Top, Averaged MUA response from the center (left) and the surround (right). Left and right columns are plotted on the same scale. The response to the first of the three stimuli in a train is shown. Each trace represents a recording from one single electrode in the array. Corresponding cortical depth is indicated on the left. The top electrode was positioned on the brain surface (depth, 0). Recordings down to 1500 μm are shown. Five-hundred stimulus trials were averaged. The electrical stimulus artifact is covered by gray rectangles. Arrows denote stimulus onset. Bottom, Averaged LFP response from the center (left) and the surround (right). Conventions are the same as for MUA. B, Top, Enlarged MUA response averaged from supragranular (depth of 0–400 μm; green), granular (depth of 500–900 μm; black), and infragranular (depth of 900–1500 μm; red) layers. The top and bottom traces correspond to the recordings from the center and the surround, respectively. Bottom, Enlarged LFP response averaged from 200 to 500 μm (layer II/III). Responses from the center (black) and the surround (red) are superimposed. Responses to all three consecutive stimuli are shown.
Figure 4.
Figure 4.
Mapping of the center of the evoked neuronal response using ball electrode measurements of surface potentials. Measurements (white traces) from nine different locations are shown. The traces are numbered in order they were recorded. The strongest amplitude and fastest rise time was observed at location 1, corresponding to the center. The locations are overlaid on the two-photon microscopy image of vasculature within the exposure. The image was calculated as a maximum intensity projection of an image stack of 0–300 μm in depth. Individual images were acquired every 10 μm.
Figure 5.
Figure 5.
Arteriolar diameter change as a function of distance from the center of evoked neuronal response. White traces show percent diameter change relative to the baseline (Δd/d) at different locations indicated by red arrows. Dilation and constriction are plotted up and down, respectively. The red circle shows the center of neuronal response. Ball electrode mapping of the center of the neuronal response for the same subject is shown in Figure 4.
Figure 6.
Figure 6.
Arteriolar vasodilatation and vasoconstriction as a function of distance from the center of evoked neuronal response. A, An average of arteriolar diameter changes (Δd/d) within 0.5 mm from the center of neuronal response (blue), in a 0.5–1.5 mm ring around the center (green), and 1.5–2.5 mm ring around the center (red) for one subject. In the right panel, the initial dilation for each ring is normalized to 3%. The inset on the right shows the color code. Dilation and constriction are plotted up and down, respectively. B, Peak dilation (top) and peak constriction (bottom) as a function of distance (in millimeters from the center of evoked neuronal response). Each dot represents a measurement from a single arteriole. Data from seven animals are superimposed. C, Three examples of the fit to the data. The fitting procedure is described in the text. The inset shows the functions C (positive) and D (negative) used to fit the data. The sum of the two normalized by the maximum of the sum of their absolute values is shown in red. D, Linear coefficients A (top) and B (bottom) as a function of distance (in millimeters from the center of the evoked neuronal response). B values are mirrored relative to the horizontal axis for better visualization (they are in fact positive). Data from seven animals are superimposed. E, The ratio of constriction to dilatation estimated as B/A as a function of distance. Each dot represents a measurement from a single arteriole. Data from seven animals are superimposed.

References

    1. Attwell D, Iadecola C. The neural basis of functional brain imaging signals. Trends Neurosci. 2002;25:621–625. - PubMed
    1. Brecht M, Sakmann B. Dynamic representation of whisker deflection by synaptic potentials in spiny stellate and pyramidal cells in the barrels and septa of layer 4 rat somatosensory cortex. J Physiol (Lond) 2002;543:49–70. - PMC - PubMed
    1. Brecht M, Roth A, Sakmann B. Dynamic receptive fields of reconstructed pyramidal cells in layers 3 and 2 of rat somatosensory barrel cortex. J Physiol (Lond) 2003;553:243–265. - PMC - PubMed
    1. Carandini M, Heeger DJ. Summation and division by neurons in primate visual cortex. Science. 1994;264:1333–1336. - PubMed
    1. Cauli B, Tong XK, Rancillac A, Serluca N, Lambolez B, Rossier J, Hamel E. Cortical GABA interneurons in neurovascular coupling: relays for subcortical vasoactive pathways. J Neurosci. 2004;24:8940–8949. - PMC - PubMed

Publication types

LinkOut - more resources